Territory Management and Planning for FMCG Distribution in India: The Complete Operational Guide
Territory management is the backbone of profitable FMCG distribution. In a country where over 12 million kirana stores are spread across 700+ districts, how you carve, assign, and monitor territories directly determines your revenue per route, cost-to-serve, and market penetration. Yet most Indian distributors still rely on legacy territory designs drawn decades ago — often based on pin codes or salesman convenience rather than commercial logic.
This guide covers everything from first-principles territory design to technology-driven territory intelligence. Whether you operate in Mumbai, Delhi, or tier-3 towns across Uttar Pradesh and Madhya Pradesh, these frameworks will help you extract more revenue from every square kilometre your salesmen cover.
Why Territory Management Matters More Than Ever
Indian FMCG distribution is undergoing rapid change. Modern trade is growing at 25% CAGR, quick-commerce is cannibalising impulse purchases, and D2C brands are eating into general trade margins. In this environment, distributors who manage territories scientifically consistently outperform those who don't — by 18-30% on secondary sales and 12-20% on collection efficiency.
Poor territory management creates a cascade of problems:
- Revenue leakage: High-potential outlets remain unvisited while salesmen spend time on low-value stops
- Uneven workloads: Some salesmen handle 180 outlets while others have 90, causing attrition and inconsistent service
- Coverage gaps: New retail clusters (housing societies, commercial complexes) go unserved for months
- Route inefficiency: Overlapping beats, backtracking, and wasted travel time inflate your distribution costs
- Poor scheme deployment: Territory-blind scheme management leads to over-investment in saturated areas and under-investment in growth pockets
Territory Design Principles for Indian FMCG Distribution
Effective territory design balances five factors: revenue potential, geographic accessibility, outlet density, competitive intensity, and workload equity. Here is how to approach each.
1. Potential Balancing
The most common mistake is designing territories by geography alone. A 5 km radius in central Pune might contain 800 outlets with Rs 45 lakh monthly potential, while a 5 km radius in the outskirts might have 120 outlets with Rs 6 lakh potential. Territories must be balanced by revenue potential, not area.
Start by estimating the Total Addressable Market (TAM) for each micro-market. Use a combination of outlet census data, category consumption indices, and SEC (Socio-Economic Classification) mapping. The goal is to create territories where each salesman has roughly equal earning potential — typically within a 15-20% variance band.
2. Natural Barriers and Accessibility
Indian cities have natural barriers that affect territory boundaries — railway lines, rivers, highways, industrial zones, and restricted areas. A territory that looks compact on a map may require 40 minutes of detour because of a railway crossing. Always validate territory boundaries with ground-level accessibility checks.
In tier-2 cities like Lucknow or Ahmedabad, traffic patterns vary dramatically by time of day. A territory designed without accounting for peak-hour congestion will under-perform every afternoon. Use route optimization tools to model realistic travel times, not straight-line distances.
3. Outlet Mix and Channel Balance
Each territory should ideally contain a healthy mix of outlet types — general trade, modern trade, HoReCa, and institutional. This ensures the salesman develops a diversified order book and isn't overly dependent on one channel. A territory dominated by modern trade will have high volumes but razor-thin margins, while a purely kirana territory may have irregular ordering patterns.
| Outlet Type | Target Mix (%) | Avg. Monthly Order (Rs) | Visit Frequency |
|---|---|---|---|
| General Trade (Kirana) | 60-70% | Rs 8,000 - 15,000 | Weekly |
| Modern Trade | 10-15% | Rs 50,000 - 2,00,000 | Bi-weekly |
| HoReCa | 10-15% | Rs 12,000 - 30,000 | Weekly |
| Institutional | 5-10% | Rs 25,000 - 75,000 | Monthly |
Beat Allocation and Optimization
Once territories are defined, the next layer is beat planning — the daily route that each salesman follows. Beat allocation is where strategy meets execution. In India, most FMCG distributors operate on a weekly beat cycle (6 working days), with each salesman covering a different micro-area each day.
The PJP (Permanent Journey Plan) Framework
The Permanent Journey Plan assigns specific outlets to specific days. A well-designed PJP ensures:
- Optimal visit frequency: A-class outlets visited twice a week, B-class weekly, C-class fortnightly
- Minimised travel time: Outlets on the same beat are geographically clustered
- Delivery synchronisation: Order-taking day aligns with delivery capacity — critical for dairy distribution where products are perishable
- Payment collection alignment: Beats scheduled so that payment collection coincides with retailer cash availability (typically market days)
For FMCG distributors handling 400-800 outlets per territory, the ideal beat structure involves 60-80 outlets per day with a productive call rate of 70-85%. That means 42-68 actual orders per day — anything below 40 signals a beat design problem or an execution issue that your sales analytics should flag immediately.
Dynamic Beat Adjustment
Static PJPs become outdated within 3-6 months as new outlets open, old ones close, and ordering patterns shift. Progressive distributors in cities like Bangalore and Hyderabad now use dynamic beat planning that adjusts weekly based on order history, stock-out alerts, and seasonal demand signals.
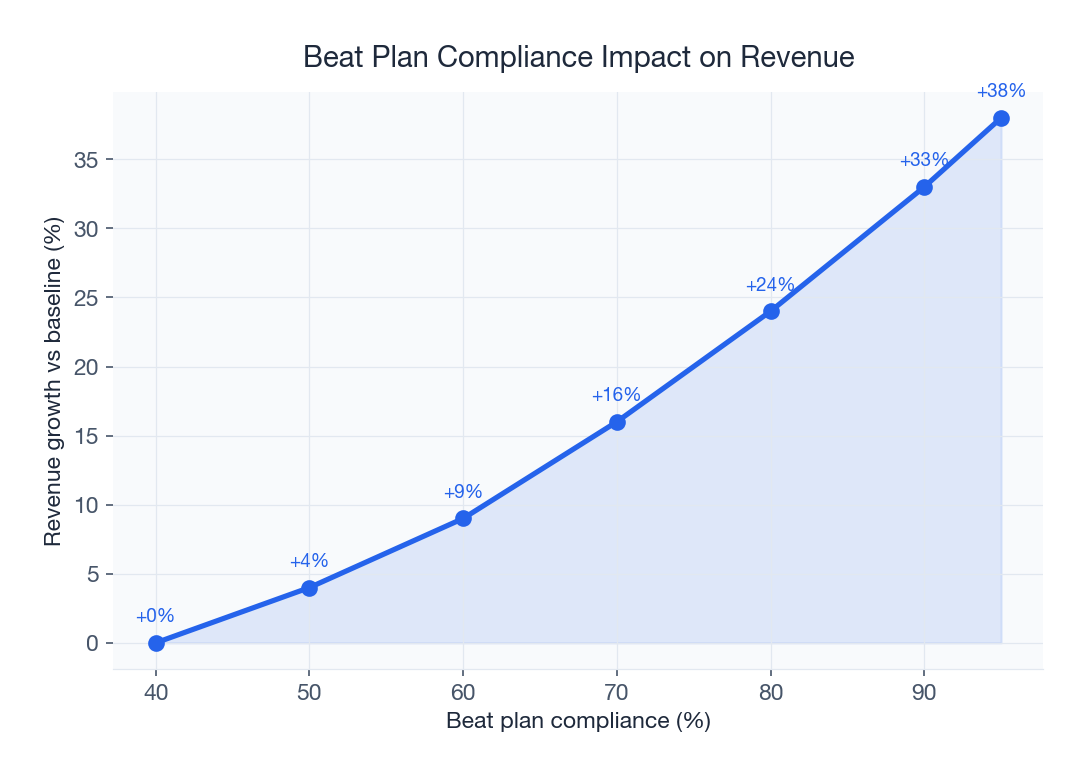
A mobile app for your field force enables real-time beat adherence tracking. You can see exactly which outlets were visited, skipped, or added ad-hoc — and use this data to continuously refine the PJP.
Territory-Wise Performance Analysis: The KPIs That Matter
You cannot manage what you don't measure. Territory-level performance analysis requires tracking a specific set of KPIs that go beyond top-line revenue. Here is a comprehensive KPI framework used by leading FMCG distributors across India.
| KPI Category | Metric | Benchmark (FMCG) | Measurement Frequency |
|---|---|---|---|
| Revenue | Secondary sales per territory | Rs 8-15 lakh/month | Weekly |
| Coverage | Universe coverage % | 85-95% | Monthly |
| Productivity | Productive calls per day | 28-35 | Daily |
| Depth | Lines per call (LPC) | 4.5-6.5 | Weekly |
| Width | Active SKU count per outlet | 12-18 | Monthly |
| Collection | Outstanding days (DSO) | 14-21 days | Weekly |
| Returns | Return rate % | <2% | Monthly |
| Growth | New outlet additions/month | 8-15 | Monthly |
The key is not just tracking these numbers but creating a territory ranking system that combines multiple KPIs into a composite score. This allows you to identify under-performing territories early and intervene — whether the issue is salesman capability, competitive pressure, or structural territory design flaws.
Using analytics dashboards that surface territory-level insights automatically saves distributors 8-10 hours of manual report compilation each week. The data flows directly from order management and distribution tracking systems into territory scorecards.
Coverage Gap Identification and Filling
Coverage gaps are silent revenue killers. Every unserved outlet in your territory is either buying from your competitor or going without — neither outcome is acceptable. Systematic coverage gap analysis involves three steps.
Step 1: Outlet Universe Mapping
Conduct a thorough outlet census for each territory. In metro cities, use a combination of GPS-tagged field surveys and third-party retail databases. In tier-2 and tier-3 cities like Surat or Kolkata, field surveys remain the most reliable method. Tag every retail outlet with coordinates, channel type, estimated category consumption, and current brand stocking.
Step 2: Gap Analysis Matrix
Compare your billed outlet universe against the total mapped universe. The gap percentage reveals untapped potential:
- Coverage gap <10%: Healthy territory — focus on depth selling and LPC improvement
- Coverage gap 10-25%: Growth opportunity — deploy targeted new outlet activation campaigns
- Coverage gap >25%: Structural issue — territory may need redesign or additional manpower
Step 3: Prioritised Activation
Not all uncovered outlets deserve equal attention. Prioritise based on estimated potential (high-footfall locations, proximity to residential clusters, competitor presence). The 80/20 rule applies powerfully here — typically 20% of uncovered outlets represent 60% of the revenue gap. Activate those first.
Expansion Planning: The Hub-and-Spoke Model for India
When expanding into new geographies, the hub-and-spoke model is the most capital-efficient approach for Indian FMCG distribution. Instead of setting up a full-fledged godown in every new town, you establish a central hub (typically in a district headquarters or major junction town) and serve surrounding spoke markets through transit points.
Hub-and-Spoke Economics
| Parameter | Full Godown Model | Hub-and-Spoke Model | Savings |
|---|---|---|---|
| Setup cost | Rs 8-12 lakh | Rs 2-4 lakh | 60-70% |
| Monthly fixed cost | Rs 1.5-2.5 lakh | Rs 40,000 - 80,000 | 65-75% |
| Break-even timeline | 12-18 months | 4-6 months | 8-12 months faster |
| Coverage radius | 25-30 km | 50-80 km | 2-3x reach |
For distributors managing multiple godowns, the hub-and-spoke model allows phased expansion with controlled risk. You can test a new market with a spoke operation for 3-6 months before committing to a full godown investment. The multi-plant distribution capability becomes essential as you scale beyond 2-3 locations.
Route-to-Market Strategy by City Tier
Your expansion approach should vary by city tier:
- Metro cities (Mumbai, Delhi, Bangalore, Chennai): Dense outlet networks, high competition, premium real estate. Focus on vertical depth — more SKUs per outlet rather than more outlets. Use retailer tracking to monitor share-of-shelf.
- Tier-1 cities (Pune, Ahmedabad, Hyderabad, Kolkata): Balanced approach with both width and depth expansion. Establish 2-3 hub locations per city for complete coverage.
- Tier-2/3 towns: Width-first strategy — maximise outlet coverage before pushing for deeper assortment. Hub-and-spoke works best here, with weekly spoke deliveries for smaller towns.
Technology-Driven Territory Intelligence
Modern distributor management software transforms territory management from a quarterly planning exercise into a continuous optimisation engine. Here is how technology changes the game.
Geo-Analytics and Heat Mapping
Overlay your sales data on geographic maps to create revenue heat maps. These instantly reveal high-potential micro-markets, dead zones, and emerging clusters. A distributor in Chennai discovered that a new IT park corridor had spawned 140 retail outlets over 18 months — completely invisible in their spreadsheet-based planning but immediately obvious on a heat map.
AI-Powered Territory Rebalancing
Machine learning algorithms can analyse historical sales data, outlet growth patterns, demographic shifts, and competitive movements to recommend territory boundary adjustments. Instead of the annual territory review that most distributors conduct, AI-driven systems flag rebalancing needs in real-time.
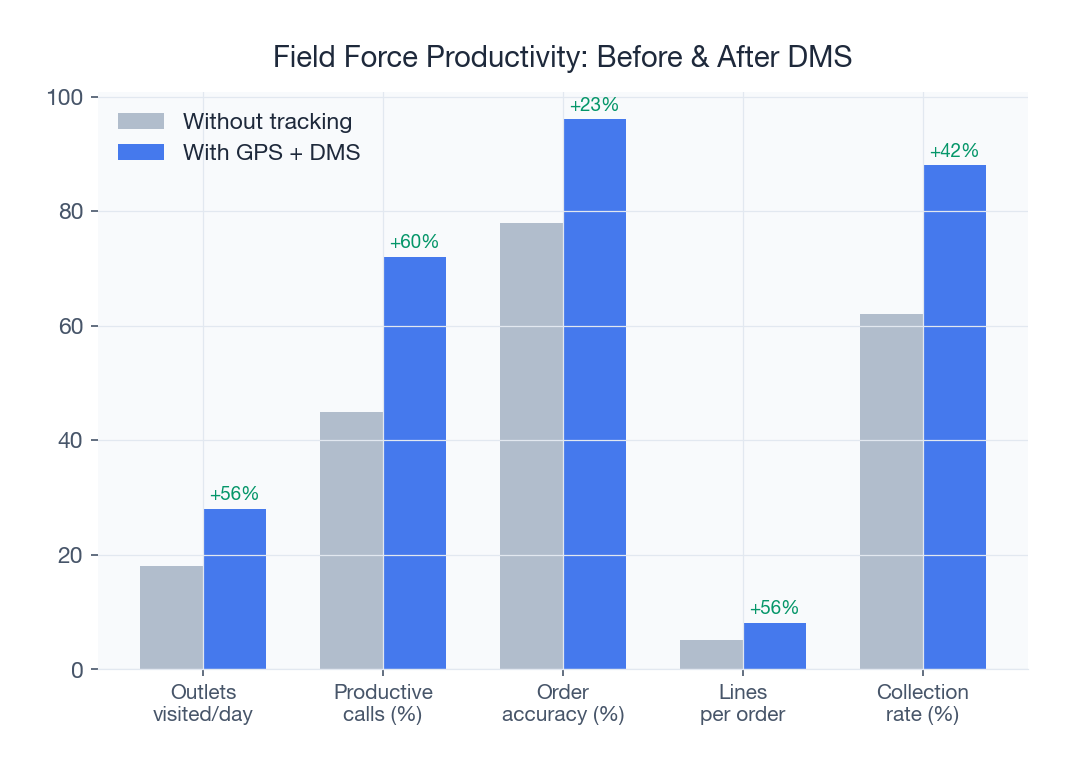
Combined with attendance tracking and field force GPS data, you get a complete picture of how territories are actually being worked versus how they were planned. The gap between planned coverage and actual coverage is where revenue leaks hide.
Integration with Billing and Inventory Systems
Territory intelligence is most powerful when connected to your billing system and inventory management. This integration enables territory-specific demand forecasting, automated reorder triggers, and demand-supply matching at the beat level.
Common Territory Management Mistakes Indian Distributors Make
Even experienced distributors fall into territory management traps that silently drain productivity and revenue. Recognising these mistakes is the first step toward correcting them.
Mistake 1: Legacy Territory Boundaries
Many distributors are still operating with territory boundaries drawn 10-15 years ago when the outlet universe was half its current size. A territory that was perfectly balanced in 2012 may now have 3x the outlet count in one area due to residential development, while another area has declined due to commercial zone conversion. Annual boundary reviews are the minimum; quarterly reviews are ideal.
Mistake 2: Ignoring Competitive Terrain
Territory design often focuses exclusively on your own outlet universe while ignoring competitor distribution strength. A territory where your competitor has 90% coverage requires a fundamentally different approach (aggressive conversion schemes, higher visit frequency) than one where you are the dominant distributor. Your field force tracking data should feed competitive intelligence back into territory planning.
Mistake 3: Over-Reliance on Top Salesmen
High-performing salesmen often mask territory design problems. A star salesman generating Rs 12 lakh from a territory designed for Rs 8 lakh creates the illusion that the territory is fine — when in reality, the territory is under-resourced and leaving Rs 5-6 lakh on the table. Territory potential should be assessed independently of salesman performance.
Mistake 4: No Formal New Outlet Discovery Process
Relying on salesmen to organically discover new outlets means you only find outlets that are convenient to their existing routes. A structured new outlet discovery programme — with dedicated time allocated on each beat day and incentives for verified new additions — consistently outperforms organic discovery by 3-4x. Tools for sales productivity can automate this process by flagging geographic gaps in your outlet map.
Comparing Manual vs. Digital Territory Management
| Aspect | Manual / Spreadsheet | Digital DMS Platform |
|---|---|---|
| Territory redesign cycle | Annual | Continuous / Quarterly |
| Beat adherence visibility | None (self-reported) | Real-time GPS-verified |
| Coverage gap detection | Months to discover | Flagged automatically |
| Performance ranking | Revenue only | Multi-KPI composite score |
| Expansion planning | Gut-feel driven | Data-driven with TAM models |
| Salesman workload balancing | Approximate | Precise (outlet count + potential) |
| Time spent on planning | 20-30 hours/month | 4-6 hours/month |
The shift from manual to digital distribution is not optional for distributors who want to remain competitive. The ROI on territory management technology typically delivers payback within 4-6 months through improved coverage, reduced travel costs, and higher productive call rates.
Implementation Roadmap: Getting Started
Transforming your territory management doesn't require a big-bang approach. Here is a phased roadmap that works for distributors of all sizes.
- Month 1 - Audit: Map your complete outlet universe, document current territory boundaries, and benchmark performance KPIs across all territories
- Month 2 - Redesign: Apply potential-balancing principles to redraw territory boundaries. Validate with ground-level accessibility checks.
- Month 3 - Digitise: Deploy a distributor management system with territory mapping, beat planning, and salesman tracking capabilities
- Month 4-6 - Optimise: Use data from the first 90 days to fine-tune beats, address coverage gaps, and rebalance workloads
- Ongoing - Scale: Expand to new territories using the hub-and-spoke model with data-driven site selection
Take Control of Your Territory Strategy
Territory management is not a one-time exercise — it is a continuous discipline that separates high-performing FMCG distributors from the rest. In India's hyper-competitive distribution landscape, the distributors who win are those who treat every square kilometre of their territory as a profit centre to be optimised, not just a geographic boundary on a map.
SpireStock provides Indian FMCG distributors with the complete territory management toolkit — from outlet mapping and beat planning to real-time performance dashboards and AI-powered rebalancing recommendations. Talk to our distribution experts to see how we can help you unlock the full potential of your territories, or explore our pricing plans to get started today.
Sources & References
- Nielsen IQ, Nielsen IQ India — FMCG Retail Measurement
- IBEF, India Brand Equity Foundation — FMCG Sector Overview
- RAI, Retailers Association of India — Retail Landscape Report
Frequently Asked Questions
Territory management is the strategic process of dividing your total addressable market into distinct geographic or account-based zones, each assigned to specific distributors, salespeople, and delivery routes. It ensures every outlet receives consistent coverage, workloads are balanced, and distribution resources are deployed efficiently across the market.
Indian FMCG territories should be designed based on revenue potential rather than geography alone. Balance each territory for comparable sales opportunity, respect natural barriers like railway lines and highways, account for outlet type mix (kirana vs modern trade), and build in 20-30% headroom for growth. Use outlet-level sales data to create balanced territories.
Beat planning determines which outlets a salesman visits on which day of the week. It translates territory strategy into daily execution. Good beat plans achieve 8-18 productive calls per day (depending on city density), maintain 80%+ strike rates, minimize travel time, and match visit frequency to outlet potential. It directly impacts sales productivity and distribution costs.
In metro cities with higher travel times, 8-12 productive calls per day is standard for general trade. In tier-2 and tier-3 cities with shorter distances, 12-18 calls per day is achievable. Modern trade outlets require 30-60 minutes per visit, so salesmen handling modern trade typically cover 4-6 accounts daily.
Territory design should be reviewed quarterly and redesigned annually or when significant market changes occur — new residential development, competitive entry/exit, or major infrastructure changes. In rapidly growing Indian cities, some zones may need re-balancing every 6 months. Continuous monitoring through sales analytics helps identify when redesign is needed.
Key metrics include numeric distribution (% of outlets stocked), weighted distribution, lines per call, strike rate, revenue per territory, collection efficiency, and return rate. Compare territories against each other after normalizing for potential, and use field force tracking data to distinguish between design problems and execution problems.
Related SpireStock Features
Related Industries
Streamline FMCG distribution with order management, beat planning, retailer tracking, and GST billing. Built for Indian FMCG supply chains.
End-to-end dairy distribution software for milk, curd, paneer, and ghee brands. Manage orders, crates, cold chain, and GST billing in one platform.
Distribution management for consumer goods brands. Manage distributors, retailers, schemes, and sales analytics across India. Start free trial.
Related Solutions
Boost field sales team productivity with beat planning, GPS attendance, order capture, and performance analytics. Built for Indian FMCG teams.
Track and manage your retail network. Geo-tag outlets, capture secondary sales, manage beats, and monitor retailer performance. Try SpireStock.
Manage your entire distributor network digitally. Onboarding, credit limits, outstanding tracking, and performance analytics. Start free trial.
Related Entities
Ready to Streamline Your Distribution?
Start your free 30-day trial and see how SpireStock can transform your dairy, FMCG or consumer-goods distribution operation, from order capture to crate recovery.
SpireStock Team
Distribution Technology Experts
SpireStock Team writes for SpireStock on distribution management, supply-chain optimisation and field operations for Indian dairy and FMCG brands.
