Why Demand Forecasting Is Fundamentally Different for Perishable Dairy Products
In most FMCG categories, safety stock is the simple buffer against demand uncertainty. If you sell 100 cases of detergent per week, you keep 30 extra cases as safety stock. The detergent does not expire for 2 years, so the cost of over-stocking is merely the working capital locked up in extra inventory. For dairy products, this entire approach collapses.
A distributor handling curd with a 10-day shelf life cannot hold 30% safety stock because those extra units sitting unsold for 3-4 days are already in the danger zone, with only 6 days of shelf life remaining when they finally ship to a retailer. For fresh milk with a 2-day shelf life, even 10% over-ordering translates to daily wastage that cannot be recovered. The margin for error in dairy demand forecasting is measured in single-digit percentages, not the 20-30% buffer that works for shelf-stable FMCG products.
This razor-thin margin creates a daily tightrope: order too little and you lose sales (unhappy retailers switch to competitors), order too much and perishable products spoil (direct financial loss plus disposal costs). A mid-sized dairy distributor in Ahmedabad or Pune with Rs 1 crore monthly turnover typically loses Rs 4-8 lakh monthly to this balancing act, split roughly equally between lost sales from stockouts and write-offs from spoilage. That is Rs 50-96 lakh annually, a staggering number that most distributors accept as inevitable but is actually highly preventable.
Understanding Daily Demand Patterns in Indian Dairy Distribution
Dairy consumption in India follows predictable daily and weekly patterns that form the foundation of any forecasting approach. These patterns are remarkably consistent across geographies, from Mumbai to Kolkata to Chennai:
- Weekday vs weekend: Milk and curd demand is 10-15% higher on weekdays driven by breakfast and cooking routines. Ice cream and flavoured milk see 20-30% higher demand on weekends, particularly Sundays, driven by family consumption and outings.
- Morning vs evening delivery: Fresh milk and curd orders peak for morning delivery (65-70% of daily volume is placed for pre-7 AM dispatch), while ice cream and beverage orders are skewed toward afternoon and evening delivery slots.
- Monday surge: Many retailers order 15-20% extra on Mondays to restock after Sunday, when most distributors do not deliver. This Monday spike is predictable yet catches unprepared distributors off-guard every week.
- Friday stocking: In areas where retailers close on Sundays, Friday orders are 15-20% higher than mid-week as shops stock up for Saturday demand.
- Month-end effect: A 5-10% dip in the last week of the month as kirana store owners manage cash flow, particularly in lower-income neighbourhoods and tier-3 towns. The dip reverses sharply in the first week of the new month.
- Salary-day surge: In areas with a high proportion of salaried consumers (IT corridors in Bangalore and Hyderabad, industrial zones in Pune), premium dairy products see a 10-15% spike around the 1st and 15th of each month.
These patterns alone, when captured systematically through a digital order management system, can improve forecasting accuracy by 30-40% over gut-feel ordering.
Seasonal Demand Swings: The Festival and Weather Calendar
Indian dairy demand has dramatic seasonal swings driven by weather, festivals, and cultural events. Missing these swings results in either massive stockouts (lost sales during peak periods) or massive wastage (unsold stock when demand dips). Here is the comprehensive seasonal calendar for dairy distributors:
| Season / Event | Products Most Affected | Demand Multiplier | Planning Lead Time | Duration |
|---|---|---|---|---|
| Summer (April-June) | Buttermilk, lassi, ice cream, flavoured milk | 1.5-2.5x | 4-6 weeks ahead | 3 months |
| Monsoon (July-September) | Milk (slight dip), curd (dip), ice cream (sharp dip) | 0.85-0.95x | 2-3 weeks ahead | 3 months |
| Shravan (August) | Milk, curd, paneer (vegetarian spike) | 1.2-1.4x | 3 weeks ahead | 1 month |
| Ganesh Chaturthi | Modak ingredients, sweets, milk | 1.5-2x (Maharashtra) | 3-4 weeks ahead | 10 days |
| Navratri / Dussehra | Paneer, ghee, sweets, curd | 2-3x | 3-4 weeks ahead | 9-10 days |
| Diwali week | Ghee, milk, sweets, paneer, cream | 2.5-4x | 4-6 weeks ahead | 5-7 days |
| Winter (December-February) | Milk, ghee, cheese, butter | 1.1-1.3x | 2-3 weeks ahead | 3 months |
| Makar Sankranti / Pongal | Ghee, til-based sweets, milk | 1.3-1.5x | 2-3 weeks ahead | 2-3 days |
| Holi | Buttermilk, thandai, sweets, cream | 1.5-2x | 2-3 weeks ahead | 2-3 days |
| Ramadan / Eid | Milk, cream, cheese, sheer khurma ingredients | 1.3-1.5x (in Muslim-majority areas) | 2-3 weeks ahead | 30 days + Eid |
| Wedding season (Nov-Feb, Apr-Jun) | Paneer, ghee, cream, sweets, ice cream | 1.5-2x (local area variations) | 2-4 weeks ahead | Varies by region |
| School reopening (June) | Packaged milk, flavoured milk, health drinks | 1.1-1.2x | 2 weeks ahead | 2-3 weeks |
A distributor who captures even one year of sales data through their analytics system can build a festival calendar that predicts demand surges with 85-90% accuracy. The data is already there in your order history; you just need a system to extract and apply the patterns.
Weather Impact on Dairy Consumption Patterns
Temperature directly and predictably influences dairy product mix. Research from the National Dairy Development Board (NDDB) and aggregated data from SpireStock customers show clear correlations:
- For every 5 degrees Celsius increase in temperature, ice cream demand increases by 15-25%
- Buttermilk and lassi demand increases by 10-20% with rising temperatures
- Hot milk consumption decreases by 10-15% in warmer weather
- Ghee and butter demand decreases by 5-10% in summer months
- A sudden cold snap in November can reduce buttermilk demand by 30% overnight
- Unseasonal rain during summer can cut ice cream demand by 20-30% for the duration
A forecasting system that incorporates weather data, easily available via APIs from the India Meteorological Department (IMD), can adjust daily orders based on 3-5 day temperature forecasts. For a distributor in Delhi where temperatures swing from 5 degrees Celsius in January to 45 degrees in June, weather-adjusted forecasting can capture demand shifts 2-3 days before they hit, the difference between having buttermilk in stock when a heatwave arrives and scrambling for emergency orders after retailers run out.
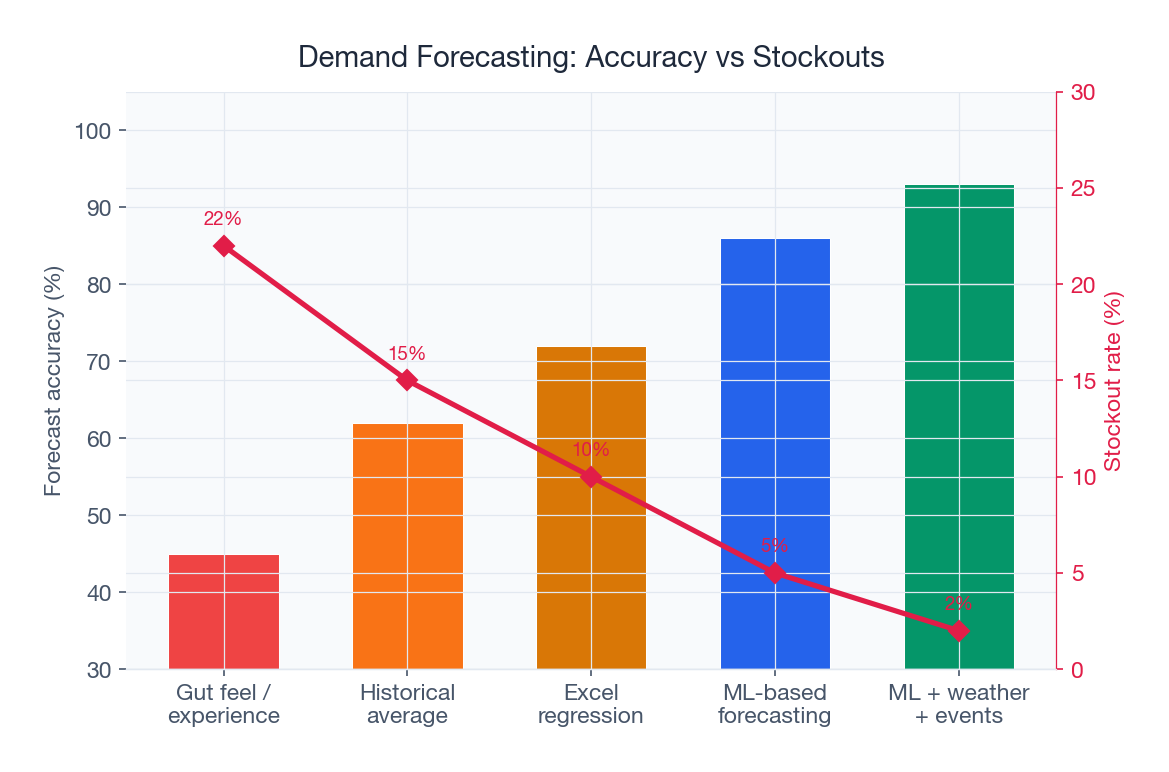
Five Practical Forecasting Approaches That Work Without AI
You do not need sophisticated artificial intelligence or machine learning to dramatically improve dairy forecasting. Here are five proven approaches that work with standard order management data available in any modern DMS:
1. Weighted Moving Average (Best for Stable Products)
Take the last 4 weeks of daily sales data for each product. Weight recent weeks more heavily: last week gets 40% weight, two weeks ago 30%, three weeks ago 20%, four weeks ago 10%. The weighted average becomes tomorrow's forecast. This method is simple to implement, responds quickly to trend changes, and works excellently for stable everyday products like milk, curd, and paneer where demand varies within a narrow band.
Example: If your Tuesday milk sales for the last 4 weeks were 120, 115, 125, and 130 litres, the weighted forecast for next Tuesday is: (130 x 0.4) + (125 x 0.3) + (115 x 0.2) + (120 x 0.1) = 52 + 37.5 + 23 + 12 = 124.5 litres. Order 125 litres.
2. Day-of-Week Pattern (Best for Capturing Weekly Rhythms)
Calculate the average sales for each day of the week over the last 8-12 weeks. Monday demand for curd might average 120 units, Tuesday 105, Wednesday 110, Thursday 108, Friday 130, Saturday 95, Sunday 85. Apply this day-specific forecast for the upcoming week. This method captures the systematic weekday-weekend variation that drives 40-50% of daily demand fluctuation in Indian dairy distribution.
3. Same-Period-Last-Year (Best for Festivals and Seasonal Events)
For seasonal and festival periods, use last year's sales for the same period, adjusted for overall business growth. If last Navratri your paneer sales were 500 cases and your business has grown 15% year-over-year, forecast 575 cases for this Navratri. This approach is essential for festival planning where demand multipliers of 2-4x make normal forecasting models useless. The sales analytics module automatically pulls same-period-last-year comparisons when known events approach.
4. Retailer-Level Forecasting (Best for Accuracy)
Instead of forecasting at the aggregate distributor level, forecast demand per retailer based on their individual ordering patterns. Retailer A in Koregaon Park orders 5 units of curd every Monday, Wednesday, and Friday. Retailer B in Kothrud orders 3 units daily. This granular approach is significantly more accurate than aggregate forecasting because it accounts for each retailer's unique consumption pattern and eliminates the averaging effect that hides individual variation. It works exceptionally well when order data is captured digitally via the mobile app and aggregated automatically.
5. Auto-Suggested Order Quantities (Best for Daily Operations)
The most practical approach for daily dairy ordering: the system generates next-day order quantity suggestions for each product at each retailer, based on recent ordering patterns adjusted for day-of-week factors, known seasonal multipliers, and any manual overrides (such as a retailer requesting extra stock for a local event). The distributor or brand salesman reviews the auto-generated suggestions, makes adjustments based on ground-level intelligence, and places the order with the manufacturer or C&F agent. This approach combines machine accuracy with human judgment.
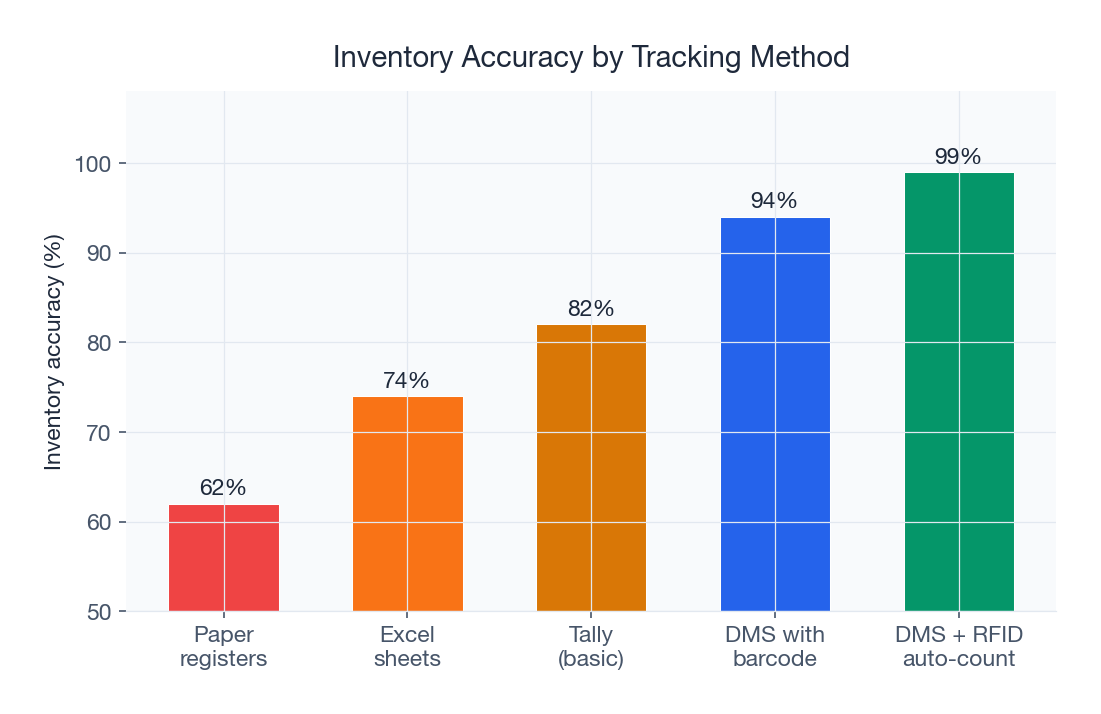
The Data Foundation: Why Accurate Capture Matters More Than Algorithms
The key enabler of better demand forecasting is not sophisticated algorithms or expensive AI tools. It is accurate, granular, digital data capture at every transaction point. When every order, every delivery, every return, and every lost sale is captured digitally through the mobile app and order management system, you have the raw material for accurate forecasts. Without digital data capture, even the best algorithm has nothing to work with.
Here is what your data foundation needs to include:
- Order data: What each retailer ordered, date, day of week, quantities per SKU
- Delivery data: What was actually delivered (may differ from order due to stock constraints)
- Return data: What was returned, with reason codes (expiry, damage, overstock)
- Stockout data: Which products were unavailable when ordered (the most critical and most commonly unmeasured data point)
- Weather data: Daily temperature and weather conditions (available via API)
- Event calendar: Festivals, local events, school holidays, and other demand drivers
Most distributors capture orders and deliveries but completely miss stockout data and return reason codes. Without knowing what you could not sell (because you did not have it), your demand data systematically underestimates true demand. A distribution management system that tracks unfulfilled orders separately from zero-order days provides this crucial missing data.
Case Study: Ahmedabad Dairy Distributor Cuts Wastage by 60%
A dairy distributor in Ahmedabad with Rs 1.2 crore monthly turnover, handling multiple dairy brands across 180 retail outlets, implemented SpireStock's forecasting module. Before implementation, the distributor relied on the owner's 20 years of experience to estimate daily orders, a method that worked reasonably well for normal days but failed consistently during seasonal transitions, festivals, and weather shifts. Results after 12 months of data-driven forecasting:
| Metric | Before (Experience-Based) | After (Data-Driven) | Improvement |
|---|---|---|---|
| Daily stockout rate | 12-15% of SKUs | 3-4% of SKUs | 73% reduction |
| Daily spoilage value | Rs 8,000-12,000 | Rs 3,000-4,500 | 60% reduction |
| Navratri planning accuracy | 30% excess ordered (wasted) | 5% variance | Near-perfect planning |
| Summer buttermilk handling | Frequent stockouts, emergency orders | Zero stockouts in peak summer | Eliminated |
| Monsoon demand adjustment | Over-ordering by 15-20% | 3-5% variance | Wastage cut by 75% |
| Annual financial impact | Baseline | Rs 52 lakh saved | Saved wastage + captured lost sales |
| Forecast vs actual accuracy | 70-75% | 92-95% | 20+ percentage point improvement |
The Rs 52 lakh annual impact came from two sources: Rs 28 lakh from reduced spoilage and write-offs, and Rs 24 lakh from captured sales that were previously lost to stockouts. The distributor's ROI on the DMS investment exceeded 15x in the first year.
Implementation Roadmap: From Manual to Data-Driven Forecasting
- Phase 1 (Month 1-2): Data Foundation. Begin capturing accurate daily sales data per product per retailer through digital order management and digital proof of delivery. Track stockouts separately from zero-order days. Record return reasons for every returned item. This phase requires discipline but no analytical capability.
- Phase 2 (Month 3-4): Pattern Recognition. With 8-12 weeks of clean data, build day-of-week demand patterns for each product category. Identify your top 20 volatile SKUs (products with highest demand variability). Set up retailer-level ordering pattern profiles. Use the analytics dashboard to visualize patterns.
- Phase 3 (Month 5-6): Seasonal Overlays. Incorporate last year's seasonal data if available, or begin building your seasonal baseline. Create festival-specific demand multipliers from historical or industry benchmarks. Integrate weather data for temperature-sensitive products. Test forecasts against actual demand for the first full seasonal cycle.
- Phase 4 (Month 7+): Auto-Suggestions and Continuous Improvement. Enable auto-suggested order quantities based on patterns plus seasonal factors plus weather adjustments. Measure forecast accuracy weekly (forecast vs actual) and refine parameters. Expand retailer-level forecasting to cover 80%+ of volume. Continuously improve based on new data and pattern evolution.
Common Forecasting Mistakes That Cost Indian Dairy Distributors Lakhs
- Over-relying on averages: Average daily demand of 100 units masks the reality that Mondays need 120 and Wednesdays need 85. Ordering the average every day guarantees you are wrong every day.
- Ignoring local events: A local temple festival, a college annual day, or a nearby school holiday can swing demand by 20-30% in a specific area. Generic seasonal models miss these hyperlocal drivers entirely.
- Not adjusting for growth: Using last year's Diwali numbers without adjusting for 15% business growth leads to systematic under-ordering during the most profitable period of the year.
- Forecast frequency mismatch: Weekly forecasts do not work for products with 2-3 day shelf life. Dairy needs daily, sometimes even twice-daily, forecasting for morning and evening dispatch cycles.
- Ignoring weather shifts: A sudden cold snap in November can reduce buttermilk demand by 30% overnight. Distributors who ordered based on last week's warm-weather pattern face immediate wastage.
- Not measuring forecast accuracy: Without tracking forecast versus actual sales for each product each day, you cannot identify which products need better forecasting and which methods work best. What gets measured gets improved.
- Treating all products equally: Your top 20% of SKUs by volume deserve daily, granular forecasting. The bottom 20% can be managed with simpler rules. Spending equal effort on all products wastes analytical resources.
Production Planning Integration: Connecting Forecasts to Manufacturing
For dairy distributors who operate as part of a vertically integrated supply chain or have close relationships with dairy plants, demand forecasts can feed directly into production planning. When the multi-plant distribution system aggregates demand forecasts from 50 distributors across a state, the dairy plant gets a consolidated production plan showing exactly how much milk, curd, paneer, and buttermilk to produce for the next day, adjusted for seasonal factors and weather.
This production-distribution integration reduces the bullwhip effect, the phenomenon where small demand fluctuations at the retail level amplify into large production swings at the plant level. For a dairy plant serving distributors across Mumbai, Pune, and Surat, aggregated demand forecasts can reduce production waste by 15-25% while simultaneously improving product availability at the distributor level.
Forecasting for New Products and New Retailers
Demand forecasting hits a cold-start problem with new products and new retailers, where no historical data exists. Practical approaches for Indian dairy distribution include:
- New products: Start with demand data from the most similar existing product. A new flavoured buttermilk variant can use existing buttermilk demand as a baseline, adjusted for the typical new-product trial multiplier (1.3-1.5x in the first month, then settling to steady state). After 4-6 weeks of actual sales data, switch to the product's own pattern.
- New retailers: Use the average demand of similar retailers in the same area. A new kirana store in a residential colony can be seeded with the average of 5 nearby kirana stores of similar size. The retailer tracking system automatically classifies new retailers and assigns proxy demand profiles.
- New territories: When expanding to a new city or area, benchmark against similar territories you already serve. A new territory in Lucknow can be seeded with data from your existing operations in a similar-sized tier-2 city, adjusted for population density and dairy consumption patterns.
Measuring Forecasting Performance: The Metrics That Matter
To continuously improve your forecasting, track these four metrics through your analytics dashboard:
| Metric | What It Measures | Target | Action if Below Target |
|---|---|---|---|
| Forecast Accuracy (MAPE) | Average percentage error between forecast and actual | Below 10% for top SKUs | Review forecasting method, check data quality |
| Stockout Rate | Percentage of SKUs unavailable when ordered | Below 5% | Increase safety stock for volatile SKUs |
| Wastage Rate | Percentage of stock expiring or damaged | Below 2% of revenue | Reduce order quantities, improve FEFO |
| Bias | Whether forecasts systematically over or under-predict | Near zero | Adjust growth factors and seasonal multipliers |
Losing sales to stockouts or money to spoilage? SpireStock's demand forecasting tools use your actual sales data, seasonal patterns, and weather intelligence to generate accurate daily order suggestions. Distributors across dairy, fresh produce, and bakery distribution have reduced stockouts by 73% and wastage by 60% within the first year. Start your free trial or view pricing to see how data-driven forecasting can transform your daily ordering.
Sources & References
- NDDB, National Dairy Development Board
- IMD, India Meteorological Department
- Nielsen India, Nielsen India Retail Intelligence
Frequently Asked Questions
Dairy products have short shelf lives (2-45 days depending on product), so over-ordering leads to direct wastage, not just working capital costs. Unlike shelf-stable FMCG where you can hold safety stock, dairy forecasting must be accurate to within 5-10% daily to avoid both stock-outs and spoilage.
You need a minimum of 8-12 weeks of daily sales data per product to build reliable day-of-week patterns. For seasonal forecasting, you need at least one full year of data to capture festival and weather-driven demand swings. The more historical data you have, the more accurate your forecasts become.
Software-driven forecasting handles predictable patterns (daily, weekly, seasonal) well but cannot predict truly unexpected events (sudden lockdowns, supply disruptions). However, by reducing forecasting error on the predictable 80% of demand variation, it frees mental bandwidth to handle the unpredictable 20%.
No. Simple statistical methods like weighted moving averages, day-of-week patterns, and same-period-last-year comparisons are highly effective for dairy forecasting. These methods work with standard DMS data and do not require data science expertise. AI adds marginal improvement for most distributors.
For new products, start with data from similar existing products and adjust based on early sales data. For new retailers, use the average demand of similar retailers in the same area. After 4-6 weeks of actual data, switch to the retailer's own pattern. The system should automatically transition from proxy to actual data.
For a dairy distributor with Rs 1 crore monthly turnover, reducing stock-outs from 12% to 4% captures Rs 8 lakh in monthly lost sales. Reducing wastage from 5% to 2% saves Rs 3 lakh monthly. Combined annual impact: Rs 50-60 lakh, which is 10-20x the cost of DMS software.
Related SpireStock Features
Related Industries
End-to-end dairy distribution software for milk, curd, paneer, and ghee brands. Manage orders, crates, cold chain, and GST billing in one platform.
Distribution management for fruits, vegetables, and perishable goods. Cold chain tracking, wastage reduction, and daily order management. Try free.
Distribution software for bakeries and confectionery brands. Manage short-shelf-life products, daily dispatch, returns, and retailer credit efficiently.
Related Solutions
Manage your entire distributor network digitally. Onboarding, credit limits, outstanding tracking, and performance analytics. Start free trial.
Boost field sales team productivity with beat planning, GPS attendance, order capture, and performance analytics. Built for Indian FMCG teams.
Manage distribution across multiple production units and plants. Centralized control with plant-level autonomy for dairy and FMCG brands.
Related Entities
Ready to Streamline Your Distribution?
Start your free 30-day trial and see how SpireStock can transform your dairy, FMCG or consumer-goods distribution operation, from order capture to crate recovery.
SpireStock Team
Distribution Technology Experts
SpireStock Team writes for SpireStock on distribution management, supply-chain optimisation and field operations for Indian dairy and FMCG brands.


