The Hidden Cost Crisis in Indian FMCG Distribution
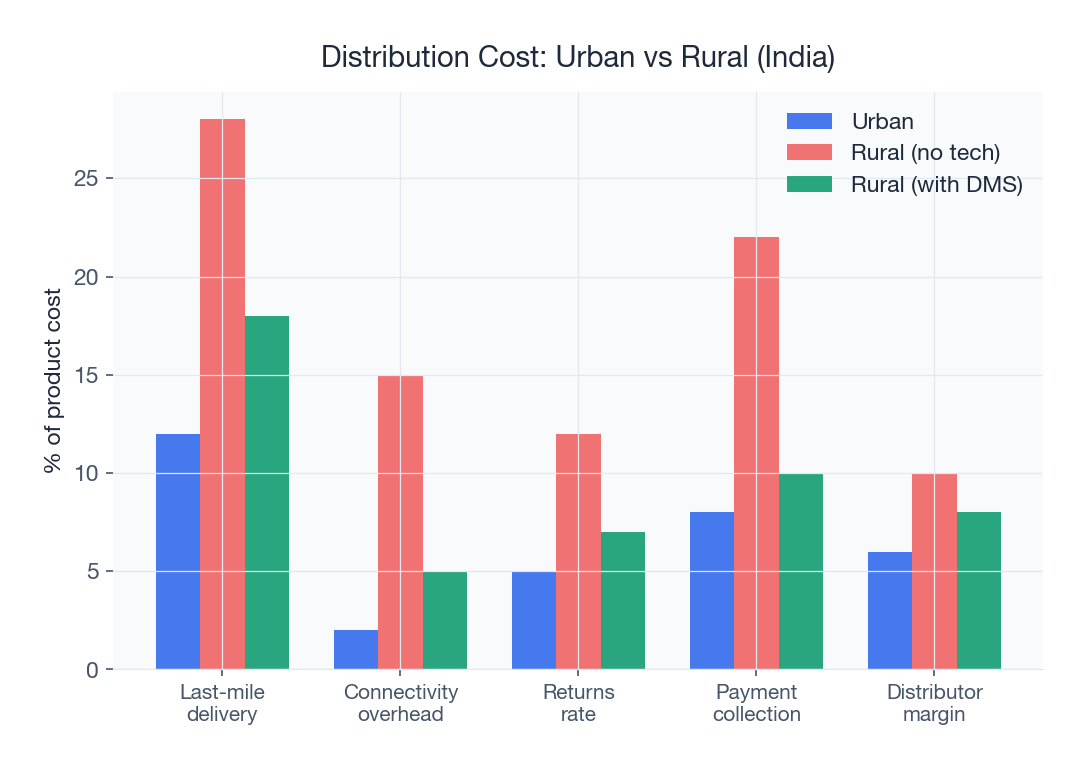
India's FMCG distribution network is one of the most complex in the world. Over 9 million retail outlets, fragmented geographies, monsoon-disrupted roads, and razor-thin margins create an environment where distribution costs can make or break a business. According to FICCI's 2024 benchmarking report, Indian FMCG companies spend 8-14% of net revenue on distribution, compared to 4-7% in developed markets. That gap represents a massive opportunity.
For a distributor doing Rs 5 crore in annual revenue, even a 3% reduction in distribution cost means Rs 15 lakh saved, money that flows directly to the bottom line. Yet most distributors in Lucknow, Surat, and hundreds of other tier-2 and tier-3 cities continue operating with the same manual processes they used a decade ago.
This guide provides a forensic breakdown of where FMCG distribution costs hide and a technology-driven playbook to cut them by 20-35%. Every strategy here is backed by real numbers from Indian distributors who have already made the shift. If you want to understand how software transforms these operations, our manual vs digital distribution comparison is a good starting point.
Anatomy of FMCG Distribution Costs in India
Before you can reduce costs, you must understand where they originate. Here is the typical cost breakdown for an Indian FMCG distributor handling Rs 3-10 crore in annual throughput:
| Cost Category | % of Distribution Cost | Typical Annual Amount (Rs) | Key Drivers |
|---|---|---|---|
| Transportation & Fuel | 35-40% | Rs 12-20 lakh | Vehicle count, route efficiency, fuel prices |
| Manpower (drivers, loaders, sales staff) | 20-25% | Rs 8-14 lakh | Headcount, productivity, overtime |
| Warehousing & Storage | 15-20% | Rs 5-10 lakh | Rent, utilities, inventory carrying cost |
| Administrative & Billing | 10-15% | Rs 4-7 lakh | Staff for invoicing, data entry, reconciliation |
| Returns & Damages | 5-8% | Rs 2-5 lakh | Expiry, transit damage, wrong delivery |
| Scheme & Discount Leakage | 3-5% | Rs 1-3 lakh | Manual calculation errors, unauthorized discounts |
For a distributor spending Rs 40 lakh annually on distribution, the combined impact of inefficiencies across these categories can exceed Rs 10-14 lakh. That is the size of the prize, and every category is addressable with the right approach.
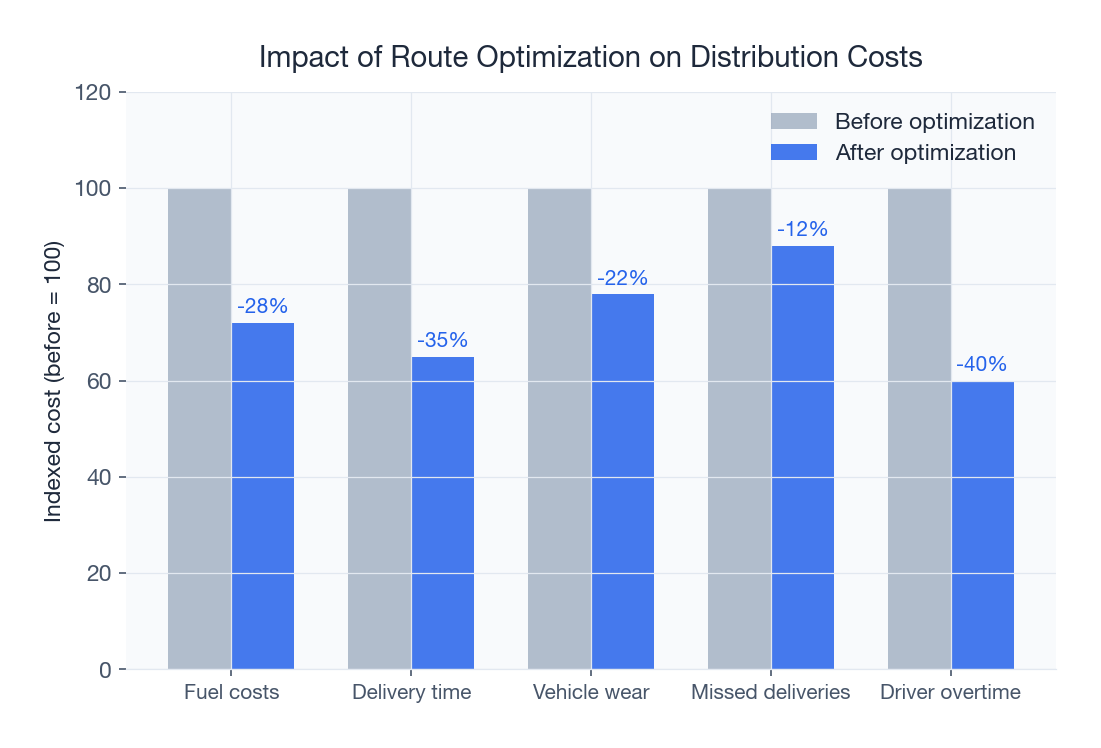
Strategy 1: Route Optimization for Fuel and Fleet Savings
Transportation is the single largest distribution cost for FMCG companies. Most Indian distributors plan routes manually, relying on driver familiarity rather than data. The result is overlapping beats, inefficient sequencing, and vehicles running at 50-60% capacity utilization.
Route optimization technology uses algorithms that consider delivery locations, time windows, vehicle capacity, traffic patterns, and order priority to generate the most efficient route sequences. The impact is immediate and measurable:
- Fuel savings of 15-25% from shorter total distance travelled per day
- 10-20% more deliveries per vehicle from better sequencing and reduced idle time
- Lower vehicle maintenance costs from reduced mileage and wear
- Fewer missed deliveries from realistic time-window planning
Real Numbers: A Pune Distributor's Route Optimization ROI
A mid-sized FMCG distributor in Pune operating 12 vehicles across 800 retail outlets implemented route optimization in March 2024. Here are their verified results after 6 months:
| Metric | Before | After | Savings |
|---|---|---|---|
| Daily km per vehicle | 85 km | 62 km | 27% reduction |
| Monthly fuel cost | Rs 1.8 lakh | Rs 1.32 lakh | Rs 48,000/month |
| Deliveries per vehicle per day | 22 | 28 | 27% increase |
| Vehicles needed for same coverage | 12 | 10 | 2 vehicles freed |
| Annual fuel savings | - | - | Rs 5.76 lakh |
They freed up 2 vehicles which were redeployed to expand into new territory, growing revenue by 15% without any additional fleet investment. For a deeper dive into route optimization for perishable goods, read our guide on route optimization for milk delivery.
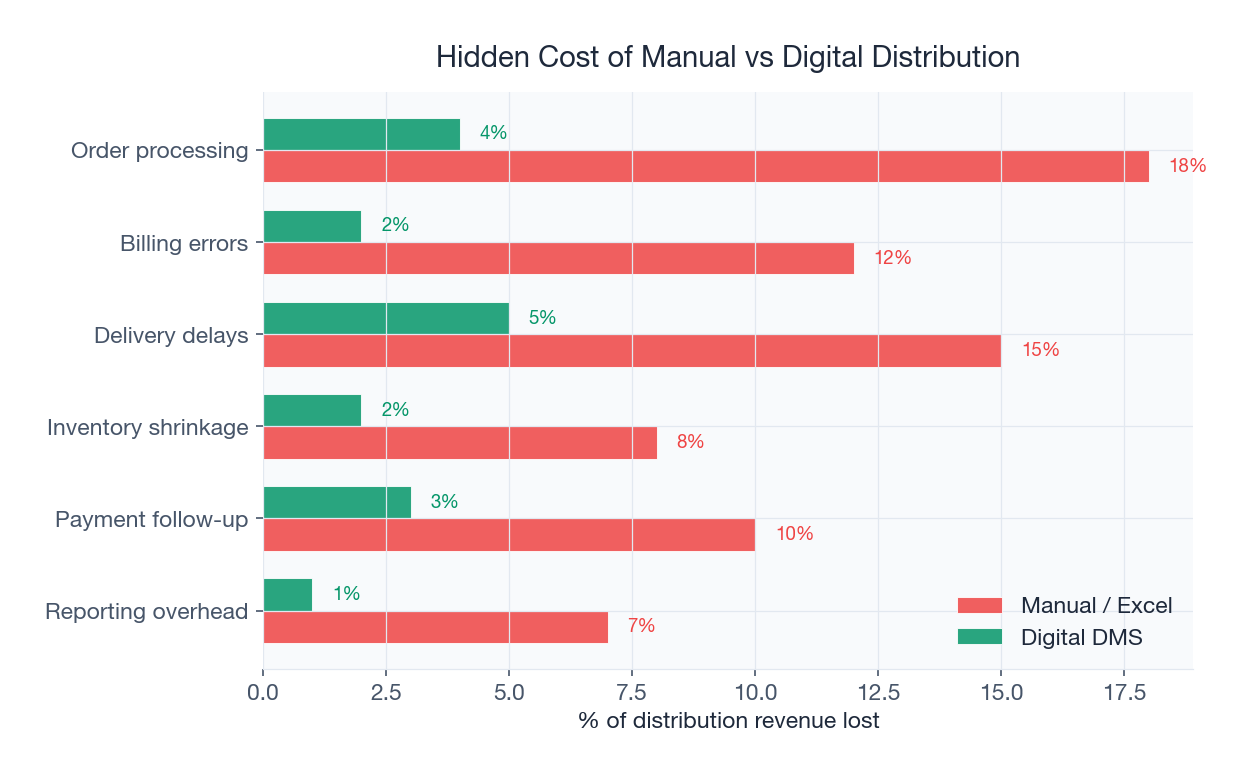
Strategy 2: Order Automation to Slash Processing Costs
Manual order processing is a hidden cost sinkhole. In a typical manual workflow, a salesman collects orders on paper or WhatsApp, sends them to the back office, where a data entry operator keys them into the billing system, a supervisor verifies and approves, and the warehouse team prints dispatch lists. This chain involves 4-5 people and takes 3-5 hours daily.
With automated order management, retailers or salesmen place orders directly through a mobile app. Orders flow into the system in real time, auto-validated against stock availability, credit limits, and pricing rules. The system generates pick lists, invoices, and dispatch plans without manual intervention.
The cost impact of order automation:
- Staff reallocation: 2-3 back-office staff freed from order entry and verification, saving Rs 4-7 lakh annually in salary costs
- Error reduction: Manual order entry has a 3-8% error rate. Each error costs Rs 200-500 to rectify (credit notes, re-delivery, phone calls). For 200 daily orders, that is Rs 2-4 lakh in annual error costs eliminated
- Faster order-to-dispatch: Orders that took 4 hours to process now flow through in 30 minutes, enabling same-day delivery that reduces stock-out losses at retail
- Better demand visibility: Real-time order data feeds into sales analytics, enabling accurate demand forecasting and reducing over-stocking by 15-20%
Read more on how retailers can place orders directly through a retailer order app for FMCG distribution.
Strategy 3: Digital Invoicing and Payment Collection
Billing errors and delayed payment collection silently erode profitability. Manual GST invoice generation is prone to HSN code errors, tax rate misapplication, and calculation mistakes, each potentially attracting penalties from Rs 10,000 to Rs 25,000 per instance during GST audits. Meanwhile, outstanding payment cycles in Indian FMCG distribution average 18-25 days, locking up working capital that could be deployed more productively.
Automated invoicing eliminates billing errors entirely. Every invoice is auto-generated with correct GST rates, HSN codes, e-invoicing compliance, and scheme adjustments. Integration with the payment collection system gives real-time visibility into outstanding amounts per retailer, enabling targeted follow-up.
A Ahmedabad-based FMCG distributor reduced their average collection cycle from 21 days to 13 days after deploying digital payment tracking, freeing up Rs 35 lakh in working capital. They also eliminated Rs 1.2 lakh in annual GST penalty risk from billing errors. For a comprehensive look at GST billing challenges, see our guide on GST billing for dairy distribution.
Strategy 4: Scheme Management to Plug Revenue Leakage
Trade schemes are the engine of FMCG sales in India, but they are also one of the biggest sources of cost leakage. When schemes are managed manually through Excel sheets and verbal communication, errors multiply: wrong discount percentages applied, schemes extended beyond validity dates, unauthorized discounts given by salesmen, and duplicate claims from retailers.
Industry estimates suggest that manual scheme management leaks 3-7% of promotional budgets. For a distributor spending Rs 20 lakh annually on trade schemes, that is Rs 60,000 to Rs 1.4 lakh lost to leakage, money that neither drives sales nor reaches intended recipients.
A digital scheme management engine enforces configured rules automatically. Slab-based discounts, buy-one-get-one offers, seasonal promotions, and retailer-tier-specific deals are applied with 100% accuracy during every transaction. There is no room for human error or manipulation. Learn more about this in our detailed post on scheme management for FMCG distribution.
Strategy 5: Fleet Management and Digital Proof of Delivery
Unmonitored fleets are expensive fleets. Without GPS tracking and fleet management, distributors cannot verify whether drivers follow planned routes, identify unauthorized stops or diversions, measure actual delivery times versus planned times, or hold drivers accountable for fuel consumption.
Real-time fleet tracking typically reveals 10-15% wasted mileage from diversions and inefficient practices. Digital proof of delivery with OTP verification, photo capture, and GPS-stamped delivery confirmation eliminates false delivery claims and reduces disputes by 40-60%. A distributor in Hyderabad handling 500 daily deliveries reduced dispute resolution costs from Rs 1.5 lakh/month to Rs 40,000/month after implementing digital POD.
Strategy 6: Sales Force Productivity and Beat Planning
An unproductive sales force is an expensive sales force. In manual operations, salesmen decide their own daily routes, skip difficult retailers, and spend untracked time between calls. Data from Indian FMCG companies shows that the average salesman makes 18-22 productive retail calls per day, while top performers using digital tools achieve 30-35 calls.
Using attendance and activity tracking combined with optimized beat planning, distributors can increase productive calls by 30-50%. The sales productivity solution provides real-time visibility into each salesman's location, call completion, and order values, enabling performance-based coaching rather than guesswork. For field force monitoring best practices, read our guide on salesman tracking apps for FMCG in India.
Comprehensive Cost Savings Model: Putting It All Together
Here is a consolidated savings model for a typical FMCG distributor in India doing Rs 5 crore annual revenue with 500-800 retail outlets, 8-12 delivery vehicles, and 6-10 salesmen:
| Optimization Area | Annual Savings (Rs) | % of Revenue | Payback Period |
|---|---|---|---|
| Route optimization (fuel + fleet) | Rs 4-8 lakh | 0.8-1.6% | 2-3 months |
| Order automation (staff + errors) | Rs 5-9 lakh | 1.0-1.8% | 2-4 months |
| Digital invoicing + payment collection | Rs 3-6 lakh | 0.6-1.2% | 1-2 months |
| Scheme leakage prevention | Rs 1-3 lakh | 0.2-0.6% | 1 month |
| Fleet management + digital POD | Rs 2-4 lakh | 0.4-0.8% | 2-3 months |
| Sales force productivity gains | Rs 3-6 lakh | 0.6-1.2% | 3-5 months |
| Total | Rs 18-36 lakh | 3.6-7.2% | 3-5 months avg |
Against an annual software investment of Rs 2-5 lakh (depending on scale and modules), the ROI is 4-12x. For a detailed ROI calculation framework, see our guide on ROI calculation for distribution software in India.
Case Study: Chennai FMCG Distributor Cuts Costs by 28%
A fast-growing FMCG distributor based in Chennai, handling 6 brands across 1,200 retail outlets in Tamil Nadu, was spending Rs 48 lakh annually on distribution against revenue of Rs 7.2 crore, a distribution cost ratio of 6.7%. Their pain points were common: manual order processing with 5% error rate, unoptimized routes, 23-day average collection cycle, and no scheme tracking.
After implementing SpireStock's distributor management solution in phases over 3 months, here are their verified 12-month results:
- Distribution cost reduced from Rs 48 lakh to Rs 34.5 lakh, a 28% reduction
- Distribution cost ratio dropped from 6.7% to 4.4% of revenue
- Collection cycle improved from 23 days to 14 days, freeing Rs 42 lakh in working capital
- Order errors dropped from 5% to 0.3%, saving Rs 3.2 lakh in re-delivery and credit note costs
- Vehicle utilization improved from 55% to 78%, allowing them to reduce fleet from 14 to 11 vehicles
- Revenue grew 22% in the same period due to increased sales force productivity and territory expansion
The total software investment was Rs 3.6 lakh for the first year. The savings of Rs 13.5 lakh meant a payback period of just 3.2 months.
Implementation Roadmap: Where to Start
You do not need to automate everything at once. Here is a phased approach that maximizes early ROI:
- Month 1-2: Order and billing automation. This delivers the fastest payback. Digitize order capture, auto-generate GST invoices, and set up payment tracking. Most distributors see tangible savings within 30 days.
- Month 2-3: Route optimization and fleet tracking. Once order flow is digital, optimize delivery routes based on real data. Add GPS tracking and digital POD.
- Month 3-4: Scheme management and analytics. Configure trade schemes digitally and deploy analytics dashboards for decision-making.
- Month 4-6: Sales force optimization. Roll out beat planning, attendance tracking, and performance analytics for the field team.
This phased approach works for distributors in Mumbai, Delhi, Bangalore, or any Indian city. The key is to start with high-impact, low-complexity modules and build from there. If you are evaluating solutions, our distribution software features checklist will help you compare options systematically.
Common Mistakes That Increase Distribution Costs
While pursuing cost reduction, avoid these traps that Indian distributors commonly fall into:
- Cutting delivery frequency to save fuel: This backfires through increased stock-outs, lost sales, and retailer dissatisfaction. Optimize routes instead of cutting service.
- Under-investing in technology to save on software costs: The Rs 2-5 lakh annual software investment saves Rs 15-35 lakh. Skipping it is a false economy.
- Ignoring data: Many distributors collect digital data but never analyze it. Without analytics, you cannot identify cost drivers or measure improvement.
- Treating all retailers equally: Not every outlet deserves the same service level. Use data to segment retailers by profitability and allocate resources accordingly.
Ready to start reducing your distribution costs? Contact SpireStock for a free distribution cost audit, or explore our pricing plans to find the right fit for your operation. You can also learn about how other FMCG distributors and dairy companies have transformed their cost structures using technology.
Sources & References
- FICCI, FMCG Distribution & Logistics Cost Benchmarking Report 2024
- NielsenIQ, India FMCG Distribution Landscape 2024
- RedSeer Strategy, India Distribution Technology Adoption Survey 2024
Frequently Asked Questions
For most Indian FMCG distributors, distribution costs range between 8-14% of net revenue. This includes transportation (35-40% of distribution cost), warehousing (15-20%), manpower (20-25%), and administrative/billing overhead (10-15%). Companies distributing perishable products like dairy or fresh produce tend to be at the higher end due to cold chain requirements and higher return rates.
Route optimization typically delivers fuel savings of 15-25% and allows distributors to serve 10-20% more outlets per vehicle per day. For a distributor with 10 vehicles, this translates to Rs 4-8 lakh in annual fuel savings and the ability to expand coverage without adding vehicles. The ROI on route optimization software is usually achieved within 2-3 months.
Yes. Modern cloud-based DMS platforms like SpireStock offer tiered pricing that starts at affordable monthly plans suitable for distributors with 50-200 retail outlets. The subscription model eliminates large upfront costs, and the savings from automation (billing errors, route efficiency, payment collection) typically exceed the software cost within the first quarter.
The highest-impact automation targets are: (1) Order capture and processing, which saves 2-4 hours of daily staff time, (2) Invoice generation with GST compliance, eliminating billing errors and penalties, (3) Payment collection tracking, which reduces outstanding cycles by 30-45%, and (4) Delivery verification with digital proof of delivery, cutting disputes by 40-60%.
Scheme leakage occurs when trade promotions are applied incorrectly, either over-applied (costing the company) or under-applied (damaging retailer relationships). In manual systems, 3-7% of promotional budgets leak due to miscalculation, unauthorized discounts, or fraudulent claims. Automated scheme engines eliminate this by applying configured rules consistently across every transaction.
Absolutely. Returns in FMCG distribution typically run 2-5% of dispatched value and are driven by expiry, damage, wrong delivery, and over-ordering. Technology reduces returns through better demand forecasting (preventing over-supply), batch-level tracking (FIFO enforcement), digital proof of delivery (eliminating wrong-delivery claims), and real-time shelf-life visibility.
Related SpireStock Features
Related Industries
Streamline FMCG distribution with order management, beat planning, retailer tracking, and GST billing. Built for Indian FMCG supply chains.
End-to-end dairy distribution software for milk, curd, paneer, and ghee brands. Manage orders, crates, cold chain, and GST billing in one platform.
Related Solutions
GPS fleet tracking, driver management, and route optimization for dairy and FMCG delivery vehicles. Reduce fuel costs by 25%. Try SpireStock.
Manage your entire distributor network digitally. Onboarding, credit limits, outstanding tracking, and performance analytics. Start free trial.
Boost field sales team productivity with beat planning, GPS attendance, order capture, and performance analytics. Built for Indian FMCG teams.
Related Entities
Ready to Streamline Your Distribution?
Start your free 30-day trial and see how SpireStock can transform your dairy, FMCG or consumer-goods distribution operation, from order capture to crate recovery.
SpireStock Team
Distribution Technology Experts
SpireStock Team writes for SpireStock on distribution management, supply-chain optimisation and field operations for Indian dairy and FMCG brands.


