Why ROI Calculation Matters Before You Buy
Every distribution software vendor will tell you their platform delivers "massive ROI." The numbers in marketing brochures look impressive, 30% cost reduction, 50% faster operations, 80% fewer errors. But these are industry averages, not your numbers. Your ROI depends on your specific operation: the number of distributors, vehicles, crates, daily orders, average invoice value, and the inefficiencies currently costing you money.
This guide gives you a rigorous framework to calculate ROI for your operation. We will walk through each savings category, provide benchmarks from Indian distribution operations, and give you a worksheet format to build your own business case. Whether you distribute dairy products from Pune, FMCG goods from Delhi, or beverages across Mumbai, the methodology applies. For context on what these platforms actually do, start with our complete guide to dairy distribution software.
According to a 2024 NASSCOM study on technology adoption in Indian FMCG, companies that calculated ROI before purchasing distribution software were 2.3x more likely to achieve their projected savings within the first year compared to those who bought based on vendor promises alone (source: NASSCOM, "Digital Transformation in Indian FMCG Distribution," Q3 2024).
The ROI Formula for Distribution Software
The basic ROI formula is straightforward:
ROI (%) = [(Total Annual Savings - Total Annual Cost) / Total Annual Cost] x 100
For payback period:
Payback Period (months) = Total Investment / Monthly Net Savings
Where:
- Total Annual Savings = Sum of all savings categories (crate loss, fuel, labour, scheme leakage, payment cycle improvement)
- Total Annual Cost = Software license + implementation + training + ongoing support
- Total Investment = First-year total cost (includes one-time implementation)
- Monthly Net Savings = (Total Annual Savings - Annual Recurring Cost) / 12
Let us break down each savings category with Indian benchmarks and a worked example for a mid-sized dairy distribution operation.
Savings Category 1: Crate Loss Reduction
Crate and returnable asset loss is the single largest "invisible" cost in Indian dairy distribution. Most operations do not even know their true crate loss rate because manual tracking is inherently unreliable. Digital crate management makes every crate visible and accountable.
Industry benchmark: Manual operations lose 8-15% of their crate inventory annually. Digital tracking reduces this to 1-3%.
Worked example:
- Total crate inventory: 50,000 crates
- Crate replacement cost: Rs 180 per crate
- Current loss rate: 12% (6,000 crates/year)
- Annual crate loss cost: 6,000 x Rs 180 = Rs 10.8 lakh
- Post-software loss rate: 2% (1,000 crates/year)
- Post-software crate loss cost: 1,000 x Rs 180 = Rs 1.8 lakh
- Annual saving: Rs 9.0 lakh
For a detailed guide on reducing crate losses, see how to reduce crate loss in dairy distribution.
Savings Category 2: Fuel Cost Optimization
Route optimization reduces total kilometres driven by eliminating inefficient routing, backtracking, and unplanned detours. The savings are directly measurable from fuel bills.
Industry benchmark: Route optimization saves 20-30% on fuel costs for distribution fleets.
Worked example:
- Number of delivery vehicles: 15
- Average daily distance per vehicle: 120 km
- Fuel consumption: 10 km/litre (typical Tata Ace / Mahindra Bolero)
- Diesel cost: Rs 90/litre
- Daily fuel cost: 15 vehicles x 120 km / 10 km/l x Rs 90 = Rs 16,200
- Annual fuel cost (300 working days): Rs 48.6 lakh
- Reduction with route optimization: 25%
- Annual saving: Rs 12.15 lakh
Savings Category 3: Scheme Leakage Prevention
Trade schemes, discounts, incentives, and promotions, are a massive cost centre in Indian FMCG distribution. When schemes are managed manually, leakage occurs through incorrect application, double-dipping, and fraudulent claims. A digital scheme engine eliminates this.
Industry benchmark: Manual scheme management has 15-25% leakage. Digital scheme engines reduce leakage to near zero.
Worked example:
- Annual scheme/promotion budget: Rs 1.2 crore
- Estimated leakage rate (manual): 18%
- Annual leakage: Rs 1.2 crore x 18% = Rs 21.6 lakh
- Post-software leakage: ~1% (Rs 1.2 lakh)
- Annual saving: Rs 20.4 lakh
Savings Category 4: Payment Cycle Improvement (DSO Reduction)
Days Sales Outstanding (DSO) measures how quickly you collect payments from distributors. Digital invoicing, automated reminders, and real-time outstanding visibility through sales analytics compress the collection cycle significantly.
Industry benchmark: Digital distribution management reduces DSO by 5-10 days.
Worked example:
- Monthly revenue: Rs 2 crore
- Current DSO: 22 days
- Post-software DSO: 14 days
- DSO improvement: 8 days
- Working capital freed: Rs 2 crore / 30 x 8 = Rs 5.33 lakh
- Cost of capital (14% per annum): Rs 5.33 lakh x 14% = Rs 0.75 lakh annual saving
- Note: The working capital freed (Rs 5.33 lakh) is a one-time benefit; the interest saving (Rs 0.75 lakh) recurs annually
Savings Category 5: Labour and Productivity Gains
Automation reduces manual effort in order processing, billing, route planning, and reconciliation. This translates to either headcount reduction or redeployment of staff to revenue-generating activities.
Industry benchmark: Distribution software saves 150-400 person-hours per month for mid-sized operations.
Worked example:
- Hours saved on order processing: 80 hours/month
- Hours saved on billing and invoicing: 60 hours/month
- Hours saved on route planning: 40 hours/month
- Hours saved on crate reconciliation: 30 hours/month
- Hours saved on payment follow-up: 50 hours/month
- Total hours saved: 260 hours/month
- Equivalent FTE (at 200 hours/month): 1.3 FTE
- Average cost per FTE: Rs 3.5 lakh/year
- Annual saving: Rs 4.55 lakh
The Complete Savings Breakdown
| Savings Category | Annual Saving (Rs lakh) | Confidence Level | Measurement Method |
|---|---|---|---|
| Crate loss reduction | 9.00 | High | Compare crate purchase invoices YoY |
| Fuel cost optimization | 12.15 | High | Compare fleet fuel bills YoY |
| Scheme leakage prevention | 20.40 | Medium-High | Audit scheme disbursement vs. budget |
| Payment cycle improvement | 0.75 | Medium | Track DSO monthly, calculate interest saving |
| Labour and productivity | 4.55 | Medium | Track hours per process before/after |
| Total Annual Savings | 46.85 |
Cost Side: What You Will Spend
| Cost Category | Year 1 (Rs lakh) | Year 2+ (Rs lakh) | Notes |
|---|---|---|---|
| Software license (SaaS) | 9.60 | 9.60 | Rs 80,000/month for 200 distributors |
| Implementation | 3.00 | 0 | One-time: setup, migration, training |
| Customization | 1.50 | 0 | Workflow-specific adjustments |
| Annual support/maintenance | 0 | Included in SaaS | Typically included in subscription |
| Total Cost | 14.10 | 9.60 |
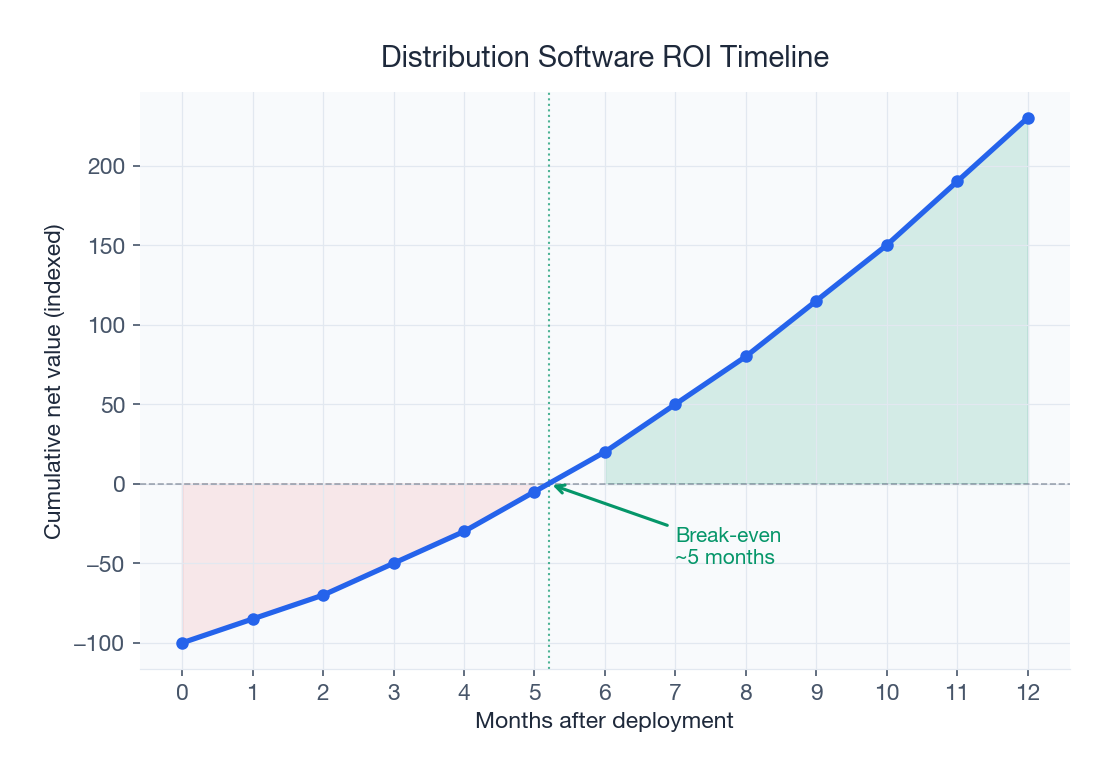
ROI and Payback Calculation
Year 1 ROI:
ROI = [(Rs 46.85 lakh - Rs 14.10 lakh) / Rs 14.10 lakh] x 100 = 232%
Payback Period:
Monthly net savings = (Rs 46.85 lakh - Rs 9.60 lakh) / 12 = Rs 3.10 lakh/month
Total first-year investment = Rs 14.10 lakh
Payback = Rs 14.10 / Rs 3.10 = 4.5 months
This means the software pays for itself before the end of the first half-year, and continues generating net savings of Rs 37+ lakh annually from year 2 onward.
Sensitivity Analysis: What If Your Numbers Are Different?
Not every operation will match our worked example. Use this sensitivity table to estimate your payback period based on different scenarios:
| Scenario | Annual Savings (Rs lakh) | Year 1 Cost (Rs lakh) | ROI (%) | Payback (months) |
|---|---|---|---|---|
| Conservative (50% of benchmark) | 23.4 | 14.1 | 66% | 8.3 |
| Moderate (75% of benchmark) | 35.1 | 14.1 | 149% | 5.6 |
| Base case (100%) | 46.85 | 14.1 | 232% | 4.5 |
| Optimistic (125% of benchmark) | 58.6 | 14.1 | 315% | 3.5 |
Even in the conservative scenario, where you achieve only 50% of the benchmark savings, the software pays for itself within 9 months and delivers 66% ROI. This wide margin of safety makes distribution software one of the lowest-risk technology investments for Indian distribution businesses.
The Payback Worksheet: Calculate Your Own Numbers
Use this worksheet format to build your custom ROI calculation:
- Crate Loss: Total crate inventory _____ x Replacement cost Rs _____ x (Current loss rate _____% - Target loss rate _____%) = Annual saving Rs _____
- Fuel: Number of vehicles _____ x Avg daily km _____ x 300 days / Mileage (km/l) _____ x Diesel cost Rs _____ x Expected reduction _____% = Annual saving Rs _____
- Scheme Leakage: Annual scheme budget Rs _____ x (Current leakage rate _____% - Target leakage rate _____%) = Annual saving Rs _____
- DSO Improvement: Monthly revenue Rs _____ / 30 x DSO reduction (days) _____ x Cost of capital _____% = Annual interest saving Rs _____
- Labour: Hours saved per month _____ / 200 x Average FTE annual cost Rs _____ = Annual saving Rs _____
- Total Annual Savings: Sum of items 1-5 = Rs _____
- Total Year 1 Cost: Software Rs _____ + Implementation Rs _____ + Training Rs _____ = Rs _____
- Year 1 ROI: [(Item 6 - Item 7) / Item 7] x 100 = _____%
- Monthly Net Saving: (Item 6 - Annual recurring cost Rs _____) / 12 = Rs _____
- Payback Period: Item 7 / Item 9 = _____ months
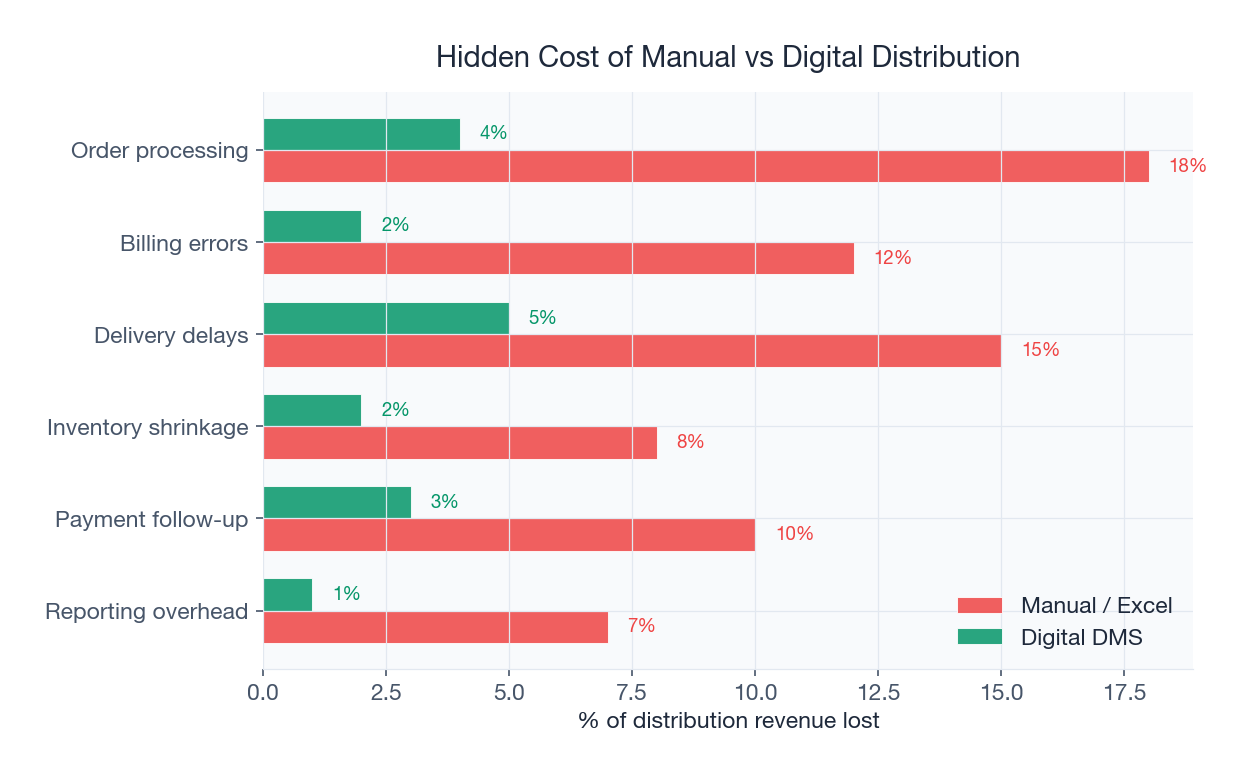
Hidden Savings Often Not Counted
The calculations above cover the primary, easily measurable savings. But there are several "hidden" benefits that are real but harder to quantify:
- Reduced billing errors, Manual invoicing errors average 3-5% in Indian distribution. Each error costs time to resolve, strains relationships, and occasionally results in write-offs. Digital billing achieves 99.5%+ accuracy.
- Better negotiating position with brands, Distributors with digital operations get better terms, exclusive territories, and premium brand allocations. This is increasingly true as brands like Amul and Mother Dairy prefer digitally-enabled channel partners.
- Insurance and compliance benefits, Digital records satisfy audit requirements, reduce insurance premiums (documented cold chain compliance), and make GST filing seamless.
- Decision speed, Real-time data means faster decisions on stock allocation, route changes, and market response. The value of speed is impossible to calculate but consistently cited as the most impactful benefit by operations managers.
Common ROI Calculation Mistakes
- Counting "potential" savings as actual, Only count savings you can measure with existing data. If you do not currently track crate losses, use the conservative (50%) scenario for that line item.
- Ignoring the implementation dip, The first 4-6 weeks after go-live typically show reduced productivity as teams learn the system. Factor this into your payback calculation by assuming zero savings in month 1 and 50% savings in months 2-3.
- Forgetting ongoing costs, Annual license renewal, additional user licenses as you grow, integration maintenance, these are recurring costs that must be subtracted from ongoing savings.
- Not measuring the baseline, If you do not measure current performance (crate losses, fuel costs, DSO, hours spent on manual processes) before implementing software, you cannot prove ROI afterward. Spend 2-4 weeks documenting baseline metrics before go-live. See our guide on DMS implementation mistakes for more on this.
- Overweighting intangible benefits, "Better customer experience" and "improved brand image" are real but should not form the core of your ROI case. Lead with hard savings numbers; intangible benefits are the cherry on top.
Conclusion: Make the Business Case with Confidence
Distribution software ROI in India is among the highest for any business technology investment. The combination of large addressable inefficiencies (crate loss, manual processes, scheme leakage) and relatively low software costs creates payback periods that are hard to beat. Even the most conservative calculation typically shows sub-9-month payback, well within a single financial year.
Use the worksheet above to calculate your specific numbers, present them to your management team or family decision-makers, and make the investment decision with data rather than gut feel. If you want help building your ROI case, talk to our team, we have built hundreds of these calculations for Indian distribution businesses and can benchmark your numbers against similar operations.
Sources & References
Frequently Asked Questions
For mid-sized operations (150-300 distributors), the typical payback period is 4-6 months. Even conservative estimates (50% of benchmark savings) show payback within 9 months. The primary savings come from crate loss reduction, fuel optimization, and scheme leakage prevention.
ROI = [(Total Annual Savings - Total Annual Cost) / Total Annual Cost] x 100. Sum savings from five categories: crate loss reduction, fuel optimization, scheme leakage prevention, DSO improvement, and labour productivity. Subtract annual software cost and one-time implementation cost. Typical Year 1 ROI for Indian operations is 150-250%.
The three largest savings categories are: scheme leakage prevention (Rs 15-25 lakh/year for mid-sized operations), fuel cost optimization via route planning (Rs 8-18 lakh/year), and crate loss reduction (Rs 8-15 lakh/year). Together these typically account for 85-90% of total measurable savings.
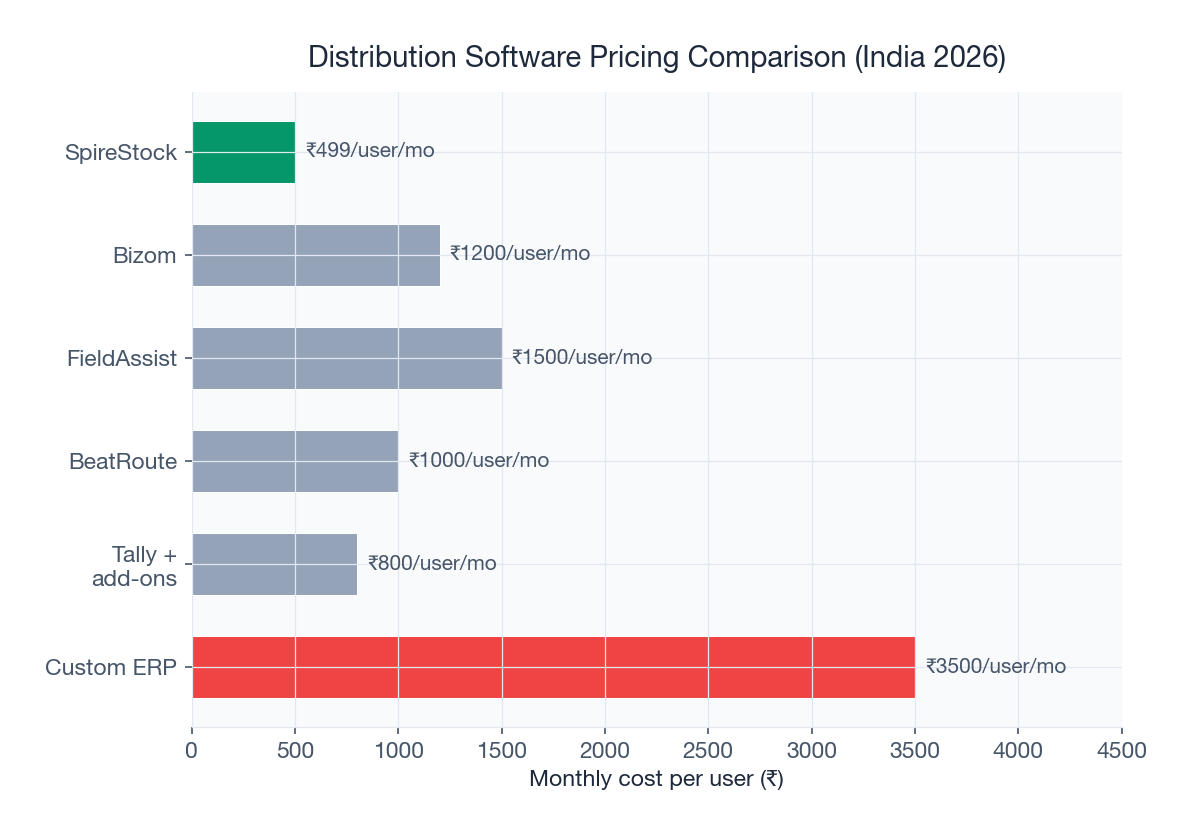
For mid-sized operations (80-300 distributors), expect Rs 5-14 lakh annually in software licensing (SaaS model). Add Rs 2-4 lakh for one-time implementation (setup, data migration, training). Total Year 1 cost is typically Rs 8-18 lakh. Costs scale with distributor count and modules used.
Track these for 4-8 weeks before go-live: daily fuel costs per vehicle, crate inventory vs. physical count (loss rate), scheme disbursement vs. budget (leakage), average DSO (payment collection days), and hours spent per process (order taking, billing, reconciliation, route planning). Without baseline data, you cannot prove ROI post-implementation.
The savings categories are the same, but magnitudes differ. Dairy operations typically see higher crate loss savings (more returnable assets) and higher fuel savings (daily perishable delivery routes). FMCG operations often see larger scheme leakage savings (more complex promotional structures). Overall ROI ranges are comparable: 150-300% in Year 1 for both segments.
Related SpireStock Features
Related Industries
End-to-end dairy distribution software for milk, curd, paneer, and ghee brands. Manage orders, crates, cold chain, and GST billing in one platform.
Streamline FMCG distribution with order management, beat planning, retailer tracking, and GST billing. Built for Indian FMCG supply chains.
Related Solutions
Manage your entire distributor network digitally. Onboarding, credit limits, outstanding tracking, and performance analytics. Start free trial.
Track distributor and retailer payments. Cash, UPI, cheque collection with reconciliation, ageing reports, and credit limit management.
Related Entities
Ready to Streamline Your Distribution?
Start your free 30-day trial and see how SpireStock can transform your dairy, FMCG or consumer-goods distribution operation, from order capture to crate recovery.
SpireStock Team
Distribution Technology Experts
SpireStock Team writes for SpireStock on distribution management, supply-chain optimisation and field operations for Indian dairy and FMCG brands.


