Slow-Moving and Non-Moving Stock Liquidation for FMCG Distributors: A Complete Working Capital Recovery Guide
Every FMCG distributor in India knows the pain of slow-moving stock — cartons sitting in the godown for weeks beyond their expected turnover cycle, tying up working capital that could be generating returns elsewhere. For a typical distributor handling Rs 50 lakh in monthly sales, slow-moving stock can lock up Rs 4-8 lakh in dead inventory at any given time. That is capital earning zero returns while rent, interest, and opportunity costs pile up.
This guide provides a systematic framework for identifying, liquidating, and — most importantly — preventing slow-moving and non-moving stock. Whether you distribute dairy products in Mumbai, FMCG goods in Delhi, or beverages in Hyderabad, these strategies will help you keep your inventory lean and your working capital productive.
Defining Slow-Moving vs. Non-Moving Stock
Before diving into liquidation strategies, it is essential to establish clear definitions. The classification depends on your product category and typical turnover cycle.
| Classification | Definition (Ambient FMCG) | Definition (Dairy/Perishable) | Working Capital Impact |
|---|---|---|---|
| Fast-moving | Sells within 15 days of receipt | Sells within 2-3 days | Healthy — capital recycling quickly |
| Normal-moving | Sells within 15-30 days | Sells within 3-5 days | Acceptable — within planned cycle |
| Slow-moving | Takes 30-60 days to sell | Takes 5-10 days to sell | Concerning — capital trapped |
| Non-moving | No movement for 60+ days | No movement for 10+ days | Critical — likely write-off candidate |
For dairy distributors, the window is brutally short. A slow-moving dairy SKU isn't just tying up capital — it is actively decaying toward expiry. For ambient FMCG distributors, the timeline is longer but the principle is the same: inventory that doesn't move is money that doesn't work.
Identifying Slow-Moving Stock: The ABC-XYZ Analysis Framework
Most distributors know about ABC analysis (classifying SKUs by revenue contribution), but few combine it with XYZ analysis (classifying by demand predictability). The combination creates a powerful matrix for identifying stock movement issues.
ABC Classification (Revenue Contribution)
- A-class: Top 20% of SKUs contributing 70-80% of revenue — your bread-and-butter products
- B-class: Next 30% contributing 15-20% of revenue — important but not critical
- C-class: Bottom 50% of SKUs contributing only 5-10% of revenue — long-tail products, often the slow-movers
XYZ Classification (Demand Predictability)
- X-category: Consistent demand with low variance (CV <20%) — easy to forecast and stock
- Y-category: Moderate demand fluctuation (CV 20-50%) — requires attention and buffer stock
- Z-category: Highly erratic demand (CV >50%) — unpredictable, highest risk of becoming slow-moving
The Combined Matrix
| X (Stable Demand) | Y (Variable Demand) | Z (Erratic Demand) | |
|---|---|---|---|
| A (High Revenue) | AX: Auto-replenish, keep safety stock | AY: Monitor closely, adjust forecasts weekly | AZ: High risk — frequent review needed |
| B (Medium Revenue) | BX: Standard reorder cycle | BY: Moderate attention | BZ: Watch list — potential slow-mover |
| C (Low Revenue) | CX: Reduce to minimum stock | CY: Consider discontinuing | CZ: Liquidation candidate — do not reorder |
The matrix immediately identifies your problem zones. CZ and CY items are prime slow-moving stock candidates. BZ items are on the watch list. Even AZ items — high revenue but erratic demand — need careful management to prevent overstocking during demand dips. Running this analysis monthly using your sales analytics dashboard ensures early detection before stock ages out.
Days of Stock (DOS) Monitoring
ABC-XYZ analysis tells you which SKUs are at risk. Days of Stock tells you how urgent the problem is. DOS is calculated as:
DOS = Current Stock Quantity / Average Daily Sales Quantity
Set DOS thresholds for each product category and configure alerts in your inventory management system:
| Product Category | Target DOS | Alert Threshold | Escalation Threshold |
|---|---|---|---|
| Fresh dairy (milk, curd) | 1-2 days | >3 days | >5 days |
| Packaged dairy (butter, cheese) | 7-10 days | >15 days | >25 days |
| Beverages | 10-15 days | >25 days | >40 days |
| Packaged foods | 15-20 days | >30 days | >50 days |
| Personal/home care | 20-30 days | >45 days | >70 days |
When DOS crosses the alert threshold, it enters your slow-moving watch list. When it crosses the escalation threshold, liquidation action must begin immediately. For distributors handling multiple godowns across cities like Ahmedabad, Pune, and Chennai, centralised DOS monitoring through a distributor management system is essential — what is slow-moving in one godown might be fast-moving in another.
Four Liquidation Strategies That Work for Indian FMCG Distributors
Once slow-moving stock is identified, you need a systematic liquidation playbook. Here are four proven strategies ranked by margin preservation — always start with Strategy 1 and escalate sequentially.
Strategy 1: Scheme-Based Push Through Existing Channels
The first and least margin-destructive approach is to incentivise your existing retail network to pick up slow-moving stock through targeted schemes. This works best when the product is not damaged or near-expiry — it is simply overstocked relative to current demand in your godown.
Effective scheme structures for slow-moving stock liquidation:
- Quantity discounts: Buy 10 cases, get 1 free (effectively 9% discount without reducing the listed MRP)
- Combo loading: Bundle slow-moving SKU with a fast-mover at a combined discount. A retailer ordering Amul butter (fast-mover) gets a discount if they also take Amul cheese spread (slow-mover)
- Retailer margin enhancement: Offer additional Rs 5-10 per unit margin to retailers who stock and display the slow-moving product prominently
- Beat-specific schemes: Target schemes only in territories where the product has demonstrated some demand, rather than blanket deployment
The scheme engine in your distribution software should allow you to create time-bound, territory-specific, and SKU-specific schemes that automatically apply during order taking. This prevents the common problem of schemes being "forgotten" by salesmen in the field. For detailed guidance on scheme structures, see our guide on scheme management for FMCG distribution.
Strategy 2: Inter-Godown Redistribution
What moves slowly in one market often sells well in another. This is particularly true in India where consumption patterns vary dramatically between regions, between urban and rural areas, and even between neighbourhoods within the same city.
A dairy distributor in Kolkata found that a flavoured lassi variant was non-moving in their central godown (primarily Hindu vegetarian locality) but had strong demand in their south Kolkata godown (mixed demographic). A simple stock transfer of 50 cases saved what would have been a near-expiry write-off.
For inter-godown redistribution to work effectively, you need:
- Unified stock visibility: Real-time inventory view across all godowns — impossible with spreadsheets, trivial with a multi-godown management system
- Transfer cost calculation: The cost of physically moving stock between godowns must be less than the margin loss from alternative liquidation methods
- Demand mapping: Know which godowns have demand for which SKUs based on historical secondary sales data
- Logistics coordination: Use existing delivery vehicles on return trips for inter-godown transfers to minimise additional transport costs
For distributors operating through multi-plant distribution networks, automated stock rebalancing alerts can flag redistribution opportunities before stock becomes a problem.
Strategy 3: E-Commerce and Alternative Channel Clearance
When traditional retail channels cannot absorb slow-moving stock, alternative channels offer a liquidation route. This is a relatively newer strategy for Indian FMCG distributors but is gaining traction rapidly.
- Quick-commerce platforms: Platforms like Blinkit, Zepto, and Instamart are always looking for discounted inventory to offer competitive pricing. They will purchase slow-moving stock at 15-25% below distributor price — lower margin, but better than a write-off
- B2B marketplace clearance: Platforms like Udaan, JioMart Business, and ElasticRun facilitate bulk clearance to smaller distributors and wholesalers in tier-3 and tier-4 towns where your slow-mover might be a novelty product with genuine demand
- Institutional sales: Hotels, canteens, catering companies, and corporate offices often purchase FMCG products at discounted rates. A slow-moving snack brand in retail might find ready demand in an office cafeteria
- Employee/staff sales: Offering slow-moving stock to your own employees at discounted rates is a last resort but ensures zero write-off on product that is still consumable
The key is speed. Once stock is flagged as slow-moving, every day of delay reduces your liquidation options. Products approaching their expiry window face rapidly declining acceptance across all channels.
Strategy 4: Company Returns (Last Resort)
Most FMCG companies have return policies that allow distributors to send back unsold stock under certain conditions. However, this should be your last resort for several reasons:
- Company return policies typically accept only products with 50%+ shelf life remaining — delaying liquidation means this window closes permanently
- Return logistics costs (freight, documentation, GST credit notes) eat into the recovery amount
- Frequent returns damage your relationship with the company and may affect future allocation of fast-moving SKUs
- Processing time for credit notes can stretch to 45-90 days, further delaying working capital recovery
When returns are necessary, ensure your GST billing system handles return documentation correctly — credit notes, debit notes, and e-way bill requirements for return shipments must be compliant.
Working Capital Impact: The Hidden Cost of Slow-Moving Stock
Many distributors underestimate how severely slow-moving stock impacts their business because they only look at the inventory value. The true cost is far higher.
| Cost Component | Calculation | Example (Rs 5 lakh slow stock) |
|---|---|---|
| Opportunity cost (lost turns) | Stock value x expected margin x missed turns | Rs 5L x 8% x 2 turns = Rs 80,000 |
| Interest cost (if financed) | Stock value x annual rate / 12 x months held | Rs 5L x 14% / 12 x 3 = Rs 17,500 |
| Warehousing cost | Space occupied x per-sqft rent x months | 100 sqft x Rs 25 x 3 = Rs 7,500 |
| Insurance and handling | Stock value x 1-2% annually | Rs 5L x 1.5% / 4 = Rs 1,875 |
| Potential write-off | Full value if product expires | Up to Rs 5,00,000 |
| Total hidden cost (3 months) | Rs 1,06,875 + write-off risk |
For a distributor with Rs 50 lakh in monthly turnover and a typical 8-12% slow-moving stock ratio, this translates to Rs 2-4 lakh in hidden costs every quarter. Over a year, that can equal or exceed your net profit margin. This is why aggressive working capital management through tools like credit limit management and inventory optimisation is critical to distributor profitability.
Prevention: Stopping Slow-Moving Stock Before It Happens
Liquidation is damage control. Prevention is where the real money is saved. Here are the systems and processes that keep your inventory lean.
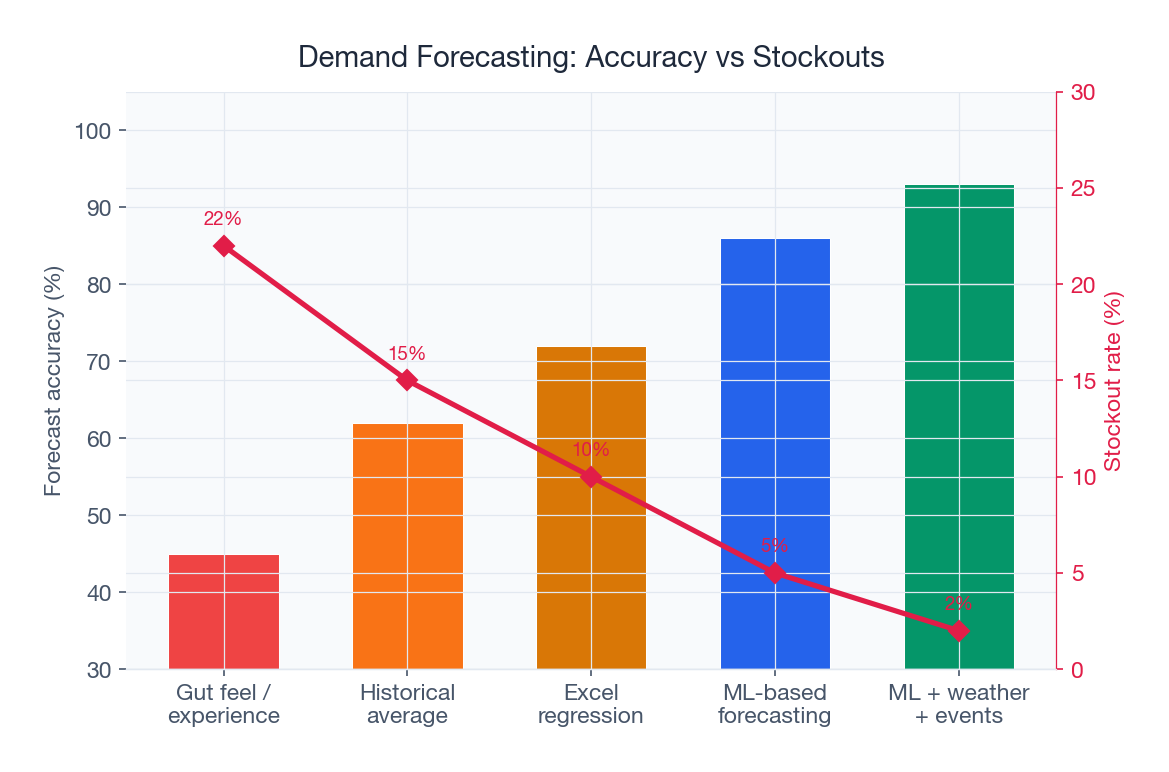
Demand Forecasting
The primary cause of slow-moving stock is ordering more than the market demands. Accurate demand forecasting reduces over-ordering by 25-40%. Modern forecasting considers:
- Historical sales patterns: Last 12 months of SKU-wise, outlet-wise sales data
- Seasonal adjustments: Festive season spikes, summer/winter demand shifts, school opening demand patterns
- Market intelligence: Competitive launches, price changes, and promotional activity that could shift demand
- New outlet ramp-up: Newly activated outlets often receive aggressive initial loading that exceeds sustainable demand
For distributors in cities like Bangalore and Lucknow, seasonal demand variation can be extreme. Ice cream and cold beverages demand in Lucknow swings 300% between winter and peak summer. Without seasonal adjustment in your forecasts, you will either stockout in June or drown in inventory in December.
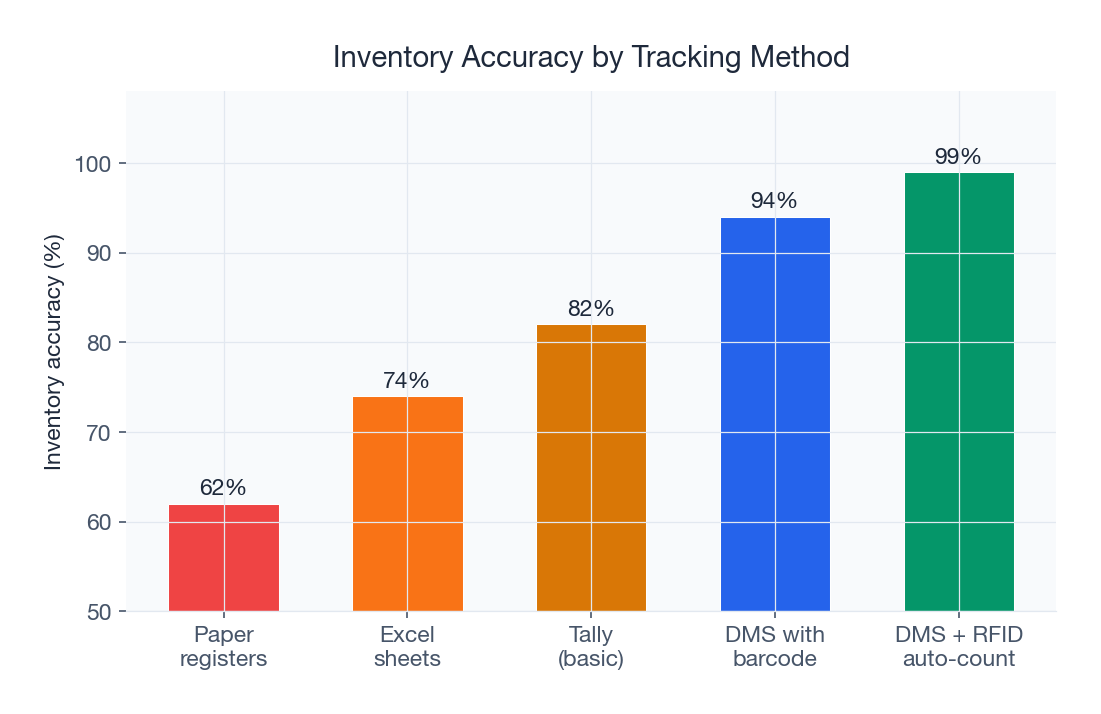
Batch-Level Tracking and FEFO Compliance
First Expiry, First Out (FEFO) is the golden rule of perishable inventory management. Without batch-level tracking, your godown staff will naturally pick the most accessible stock — which is often the newest stock — leaving older batches to age into the slow-moving category.
Digital batch tracking through your distribution tracking system enforces FEFO automatically. During order allocation, the system selects the earliest-expiring batch first, ensuring continuous stock rotation and preventing hidden inventory ageing.
SKU Rationalisation
Many distributors carry too many SKUs relative to their market's absorptive capacity. A distributor handling 400 SKUs in a territory that can productively sell 250 is guaranteed to have slow-moving stock. Regular SKU rationalisation — quarterly reviews where you evaluate whether each C-class SKU earns its shelf space — is essential.
Use your outlet-level sales analysis to identify SKUs that sell in fewer than 10% of your outlets. These are candidates for range reduction unless they serve a strategic purpose (new launch, portfolio completion for key retailers, etc.).
The Review Cadence Framework
Preventing and managing slow-moving stock requires structured, regular review cycles. Here is a framework that works for distributors across all FMCG categories.
| Review | Frequency | Participants | Key Actions |
|---|---|---|---|
| DOS dashboard check | Daily | Godown manager | Flag any SKU crossing alert threshold |
| Slow-mover review | Weekly | Sales manager + godown manager | Initiate liquidation for flagged SKUs, review scheme effectiveness |
| ABC-XYZ reanalysis | Monthly | Distributor owner + sales team | Reclassify SKUs, adjust reorder quantities, review CZ items |
| SKU rationalisation | Quarterly | Distributor + company representative | Discontinue persistent non-movers, negotiate return policies |
| Inventory health audit | Bi-annually | Full team + auditor | Physical verification, write-off decisions, process improvements |
This cadence ensures that no slow-moving SKU goes undetected for more than a week. The daily DOS check is the critical first line of defence — it takes only 10 minutes with a proper analytics dashboard but catches problems that would otherwise fester for months.
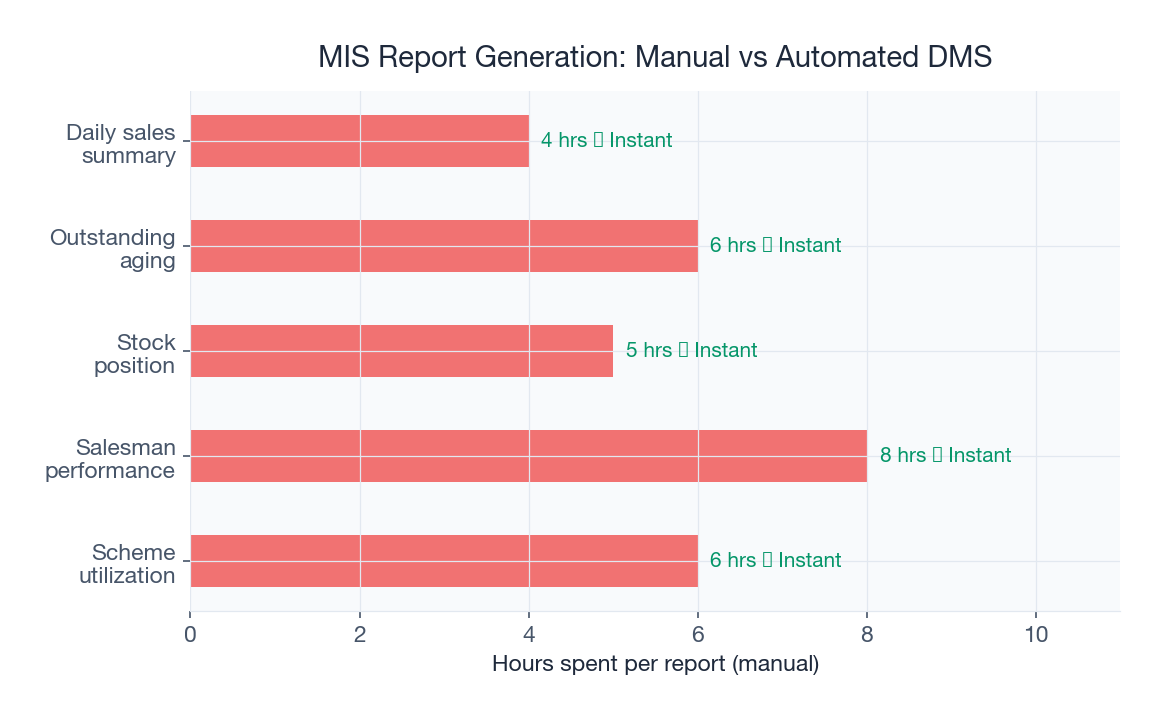
Technology as the Enabler
Every strategy in this guide becomes dramatically more effective with the right technology stack. Manual inventory tracking using registers and spreadsheets simply cannot provide the real-time visibility needed for proactive slow-stock management. The shift from manual to digital distribution management is what separates distributors who manage slow stock from those who discover it during annual audits.
Key technology capabilities for slow-moving stock management:
- Automated DOS alerts that notify you the moment any SKU crosses threshold
- ABC-XYZ classification engine that recalculates automatically as sales data updates
- Multi-godown stock visibility for instant redistribution opportunity identification
- Scheme engine for rapid deployment of SKU-specific liquidation offers through the mobile app
- Batch tracking with expiry countdown and FEFO enforcement
- Integration with order management to prevent over-ordering at the point of indent
Stop Bleeding Working Capital to Dead Stock
Slow-moving stock is not an inevitable cost of doing business — it is a manageable, preventable problem. Indian FMCG distributors who implement systematic identification (ABC-XYZ + DOS monitoring), structured liquidation (the 4-strategy playbook), and proactive prevention (demand forecasting + batch tracking + SKU rationalisation) consistently maintain slow-stock ratios below 3% versus the industry average of 10-15%.
That difference translates directly to your bottom line — healthier working capital, fewer write-offs, and capital freed up for growth investments. Every rupee locked in non-moving stock is a rupee not earning returns through your next inventory turn.
SpireStock gives Indian FMCG distributors the complete inventory intelligence toolkit — from real-time DOS monitoring and automated ABC-XYZ classification to multi-godown redistribution alerts and integrated scheme deployment for stock liquidation. Talk to our team to see how we can help you reclaim working capital trapped in slow-moving inventory, or explore our pricing plans to find the right fit for your distribution business.
Sources & References
Frequently Asked Questions
Slow-moving stock refers to SKUs selling at less than 50% of their expected velocity over a 30-day period. For Indian FMCG distributors, any item with more than 20-25 days of stock on hand relative to its sales rate is typically classified as slow-moving.
A distributor with Rs 1.5 crore monthly turnover typically has Rs 4.5-6 lakh locked in slow-moving inventory at any time, with total annual losses including write-offs, interest, and space costs reaching Rs 6-13 lakh.
The most effective approach combines scheme-driven push (trade discounts and combo offers), inter-godown redistribution to territories with higher demand, modern trade and e-commerce clearance, and company returns for near-expiry items.
Yes. Distribution management software with demand forecasting, real-time DOS monitoring, and automated alerts can reduce slow-moving stock incidence by 40-60%. The system flags potential slow-movers within 7-10 days of velocity decline, allowing early intervention.
Best practice is daily automated dashboard checks (5 minutes), weekly slow-mover review meetings, monthly full portfolio ABC-XYZ analysis, and quarterly strategic reviews with principal companies to align on forecasts and return policies.
Non-moving stock has zero sales for 30-60 days but may still be saleable with effort. Dead stock has been non-moving for 60+ days or is within 30 days of expiry. Dead stock typically requires deep discounting or write-offs, while non-moving stock can often be salvaged through schemes and redistribution.
Related SpireStock Features
Powerful dashboards with sales trends, MIS reports, and distribution analytics.
Flexible incentive schemes, flat, bulk-pack, and quantitative, applied automatically.
Real-time GPS tracking of vehicles and drivers with route optimization for faster deliveries.
Related Industries
Streamline FMCG distribution with order management, beat planning, retailer tracking, and GST billing. Built for Indian FMCG supply chains.
Distribution management for consumer goods brands. Manage distributors, retailers, schemes, and sales analytics across India. Start free trial.
Related Solutions
Manage your entire distributor network digitally. Onboarding, credit limits, outstanding tracking, and performance analytics. Start free trial.
Automate trade schemes, incentives, and promotional offers. Flat, bulk-pack, quantitative, and FOC schemes with ROI tracking. Try SpireStock.
Related Entities
Ready to Streamline Your Distribution?
Start your free 30-day trial and see how SpireStock can transform your dairy, FMCG or consumer-goods distribution operation, from order capture to crate recovery.
SpireStock Team
Distribution Technology Experts
SpireStock Team writes for SpireStock on distribution management, supply-chain optimisation and field operations for Indian dairy and FMCG brands.


