Why Outlet-Wise Sales Analysis Is the Most Underleveraged Tool in FMCG Distribution
The average FMCG distributor in India serves 400-1,200 retail outlets. Yet when asked which outlets are their most profitable, which are declining, or which carry fewer than half their SKUs, most distributors cannot answer with data. They rely on salesman intuition, anecdotal feedback, and aggregate numbers that mask the enormous variation in outlet-level performance.
This blind spot costs real money. A distributor in Mumbai with 800 outlets might discover — once they actually measure — that 15% of their outlets generate 55% of revenue, 30% of outlets have not placed an order in 45+ days, and the average outlet stocks only 35% of the distributor's available SKU range. Each of these insights represents a concrete growth opportunity worth lakhs in additional annual revenue.
Outlet-wise sales analysis is the practice of tracking, segmenting, and acting on retailer-level purchase data. With the right sales analytics platform, Indian FMCG distributors can identify growth outlets, reactivate dormant ones, improve SKU penetration, and make data-driven decisions about territory allocation, scheme targeting, and sales team deployment.
The Indian FMCG Distribution Context
India's FMCG distribution landscape is uniquely complex. Over 12 million kirana stores, general trade outlets, and modern trade points form the retail backbone of a Rs 6.5 lakh crore industry. The distribution chain typically runs: Brand → Super Stockist → Distributor → Retailer → Consumer. At the distributor level, outlet management is where the rubber meets the road.
Most distributors in cities like Delhi, Bangalore, or Hyderabad operate with 5-15 salesmen covering beats across their territory. Each salesman visits 25-40 outlets daily, taking orders, collecting payments, and managing relationships. Without systematic outlet analysis, the salesman's route, time allocation, and selling priorities are driven by habit rather than data. A salesman might spend 20 minutes at a low-value outlet because he has a personal rapport with the owner, while rushing through a high-potential outlet that could triple its purchases with the right attention.
Core Components of Outlet-Wise Sales Analysis
1. Retailer Segmentation
The foundation of outlet analysis is segmenting your retailer base into actionable categories. The most effective segmentation for Indian FMCG distributors combines multiple dimensions:
Revenue-based segmentation (ABC analysis):
- A-class outlets: Top 15-20% by revenue — these are your anchor accounts. Typical monthly billing: Rs 50,000+
- B-class outlets: Middle 30-35% — steady contributors with growth potential. Monthly billing: Rs 15,000-50,000
- C-class outlets: Bottom 45-50% — low-volume outlets that may or may not be worth serving. Monthly billing: under Rs 15,000
Frequency-based segmentation:
- Regular: Orders at least 3 times per week (dairy) or weekly (packaged goods)
- Irregular: Orders 1-2 times per month — usually indicates a secondary supplier relationship
- Dormant: No orders in 30+ days — requires reactivation effort or formal exit from the beat
The retailer tracking solution automates this segmentation, updating classifications in real time as purchase patterns change. This dynamic segmentation is far more useful than static lists that go stale within weeks.
2. Purchase Frequency Analysis
Understanding how often each outlet orders — and how that frequency changes over time — reveals critical trends. A retailer who ordered 4 times a week for six months and has dropped to once a week is sending a clear signal: they have likely found an alternative supplier, are facing a cash crunch, or are dissatisfied with service. Distribution tracking captures these patterns automatically, flagging frequency drops before they become permanent losses.
For dairy distributors, where daily ordering is the norm, even a 2-day gap from a regular outlet warrants attention. For packaged FMCG, the benchmark is weekly orders from regular outlets. The software calculates average order frequency per outlet, compares it against historical baselines, and generates exception reports for outlets deviating from their established patterns.
3. SKU Penetration Analysis
SKU penetration measures what percentage of your available product range each outlet actually purchases. If you distribute 150 SKUs but the average outlet buys only 25, you have a penetration rate of just 17% — indicating massive untapped potential.
The analysis gets more valuable when you drill down. A kirana store in Pune might buy your biscuits and soaps but has never ordered your premium snacks range — not because there is no demand, but because the salesman never introduced those products. SKU penetration reports, segment-by-segment, give sales managers the specific talking points for each outlet visit: "This outlet buys 8 of our 12 personal care SKUs but zero home care products — here is the recommendation for next visit."
4. Outlet Growth Opportunity Scoring
By combining revenue data, frequency trends, SKU penetration, and outlet characteristics (location, store size, footfall estimates), the analytics engine can score each outlet on growth potential. High-scoring outlets — those with strong frequency, moderate current billing, but low SKU penetration — are your best candidates for salesforce attention and targeted schemes.
This scoring model helps sales managers allocate time and resources rationally. Instead of spreading effort evenly across all 800 outlets, the team focuses on the 150 outlets with the highest growth scores, where incremental effort yields disproportionate returns.
5. Dormant Outlet Identification and Reactivation
Every distributor has outlets that quietly stop ordering. Without systematic tracking, these losses go unnoticed for weeks or months. Outlet analysis flags dormant outlets — those with no orders in 30, 45, or 60 days — and triggers reactivation workflows.
Reactivation strategies include targeted schemes (a one-time discount to restart ordering), salesman visits with new product samples, credit limit adjustments if the pause was cash-flow related, or formal exit if the outlet has permanently closed or switched categories. The scheme engine can configure outlet-specific reactivation offers that auto-apply when a dormant outlet places its comeback order.
Building a Data-Driven Outlet Strategy
Step 1: Baseline Your Outlet Universe
Start by getting a complete picture. How many total outlets are in your distribution territory? How many are active (ordered in the last 30 days)? What is the revenue distribution across A/B/C segments? What is the average SKU penetration? This baseline reveals where you stand today and quantifies the opportunity gap.
Step 2: Identify Quick Wins
Quick wins come from three areas: (a) B-class outlets with high SKU penetration that could become A-class with slightly more volume — offer them volume-linked incentives; (b) A-class outlets with low SKU penetration — they trust you and buy frequently, they just need exposure to more products; (c) Recently dormant outlets (30-45 days) — these are easiest to reactivate before the relationship goes cold.
Step 3: Restructure Beats Based on Data
Traditional beat planning assigns outlets to salesmen based on geography. Data-driven beat planning layers outlet value, growth potential, and visit frequency requirements on top of geography. High-value A-class outlets might need 3 visits per week; low-value C-class outlets might need just one. Read our detailed guide on beat planning for FMCG distribution for implementation strategies.
Step 4: Set Outlet-Level Targets
With baseline data and growth scoring, you can set realistic targets for each outlet — not just aggregate territory targets that salesmen distribute arbitrarily. Outlet-level targets drive accountability and give salesmen specific objectives for each visit. The sales productivity solution tracks target vs. achievement at the outlet, salesman, beat, and territory levels.
Outlet Analysis Metrics That Matter
| Metric | What It Measures | Benchmark (Indian FMCG) | Action if Below Benchmark |
|---|---|---|---|
| Active outlet ratio | % of mapped outlets ordering in last 30 days | 75-85% | Investigate dormancy causes, launch reactivation |
| Average SKU penetration | % of available SKUs bought per outlet | 25-40% | Cross-sell campaigns, salesman training |
| A-class outlet share | % of revenue from top 20% outlets | 50-60% | If above 70%, diversification needed |
| Order frequency (dairy) | Orders per week per active outlet | 5-6 times | Check competition, service quality |
| Order frequency (FMCG) | Orders per month per active outlet | 3-4 times | Increase visit frequency, improve availability |
| Dormancy rate | % of outlets with no order in 30+ days | Under 15% | Immediate reactivation programme |
| Revenue per outlet | Average monthly billing per active outlet | Rs 18,000-35,000 | Focus on upselling and category expansion |
Technology Stack for Outlet Analysis
Effective outlet analysis requires data from multiple systems working together. The order management module provides transaction-level purchase data. The distribution tracking system adds delivery confirmation and visit data. The attendance and field tracking module logs salesman visits per outlet, time spent, and activities performed. Together, these data streams feed the analytics engine that produces the segmentation, scoring, and recommendations described above.
For distributors still operating on manual systems, the transition to data-driven outlet management is transformative. Read our comparison of manual vs. digital distribution to understand the full scope of what changes — and what stays the same.
Real-World Impact: What Indian Distributors Achieve
A consumer goods distributor in Ahmedabad serving 650 outlets implemented outlet-wise analysis and discovered that 180 outlets (28%) had not ordered in 45+ days. A focused reactivation campaign — combining salesman visits, targeted discount schemes, and credit limit reviews — brought 120 of those outlets back to active status within 6 weeks, adding Rs 14 lakh in monthly revenue.
An FMCG distributor in Chennai used SKU penetration data to identify that their top 100 A-class outlets carried an average of only 40% of available SKUs. A structured cross-selling programme, with salesman-specific recommendations generated from the analytics dashboard, pushed average penetration to 62% within 3 months — a Rs 22 lakh monthly revenue increase with zero new outlet acquisition.
These results are not exceptional. They are the predictable outcome of replacing intuition with data. For more on the financial returns of distribution software, see our ROI calculation guide.
Connecting Outlet Analysis to Scheme Management
Outlet-level data makes trade schemes far more effective. Instead of blanket promotions that benefit all outlets equally (including those who would have ordered anyway), you can design targeted schemes for specific outlet segments. Reactivation schemes for dormant outlets. SKU introduction offers for outlets with low category penetration. Volume kicker schemes for B-class outlets on the cusp of A-class status. The scheme management guide details how to structure these targeted promotions for maximum ROI.
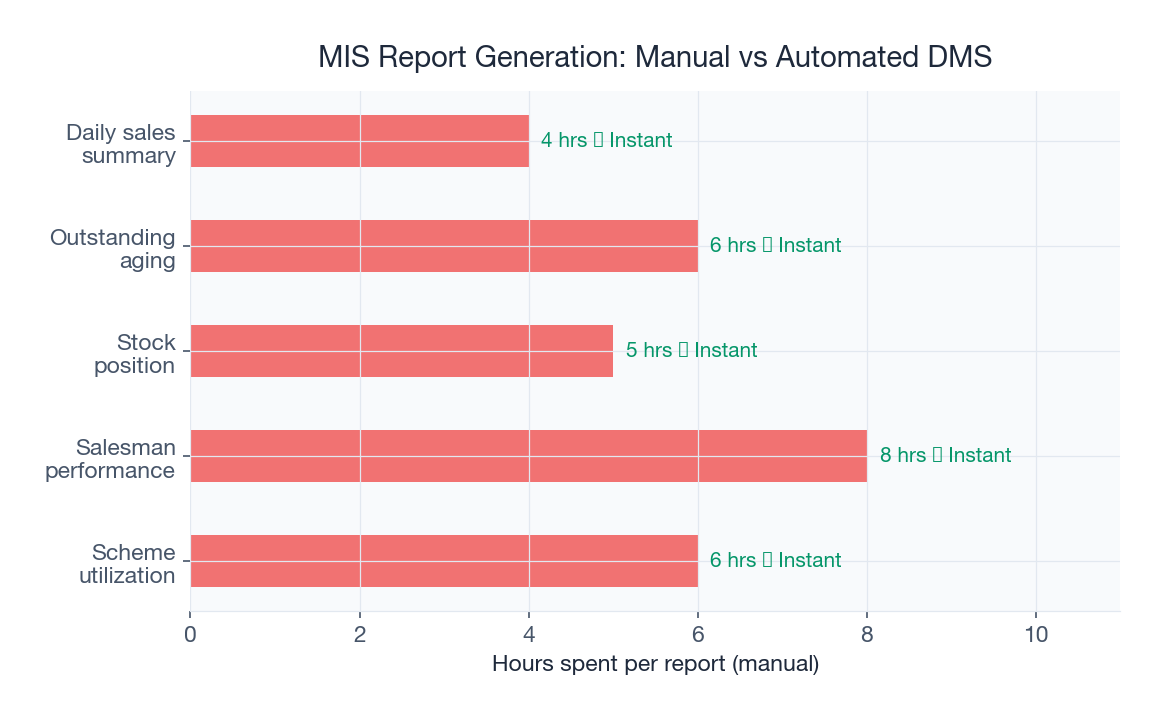
MIS Reporting and Brand Principal Communication
Brand principals increasingly demand outlet-level data from their distributors — active outlet counts, numeric distribution (how many outlets stock a product), weighted distribution (what share of volume those outlets represent), and growth trends. Automated MIS reports generated from outlet analysis data satisfy these requirements effortlessly, strengthening the distributor's position as a data-savvy channel partner. Distributors who provide clean, timely outlet data often receive preferential scheme allocations and territory expansions from brand principals.
Frequently Asked Questions
What is outlet-wise sales analysis for FMCG distributors?
Outlet-wise sales analysis is the practice of tracking and segmenting individual retailer purchase data — including order frequency, SKU penetration, revenue trends, and growth potential — to make data-driven decisions about sales team deployment, scheme targeting, beat planning, and territory strategy.
How does retailer segmentation help distributors grow revenue?
By classifying outlets into A/B/C categories based on revenue, frequency, and potential, distributors can allocate salesman time and promotional budgets to outlets with the highest growth opportunity. This focused approach typically drives 15-25% revenue growth from the existing outlet base without adding new territory.
What is SKU penetration and why does it matter?
SKU penetration is the percentage of your available product range that each outlet purchases. Low penetration (under 25%) indicates massive cross-selling opportunity. Improving average SKU penetration from 30% to 50% can increase outlet-level revenue by 40-60% — making it the single highest-ROI growth lever for most distributors.
How do you identify and reactivate dormant outlets?
The analytics system flags outlets with no orders in 30+ days as dormant. Reactivation involves a combination of salesman visits, targeted discount schemes, credit limit reviews, and new product introductions. Typically, 50-70% of recently dormant outlets (30-60 days) can be reactivated with focused effort.
What technology is needed for outlet-level analysis?
You need a distribution management system that captures transaction-level data per outlet, combined with sales analytics and field tracking capabilities. SpireStock integrates order management, distribution tracking, attendance monitoring, and analytics into a single platform that produces outlet-level insights automatically.
How quickly can distributors see results from outlet analysis?
Most distributors see measurable results within 4-6 weeks of implementing systematic outlet analysis. Quick wins from dormant outlet reactivation and A-class SKU expansion typically add 10-15% to monthly revenue within the first quarter.
Unlock growth from your existing outlet base. SpireStock's outlet analytics gives FMCG distributors across India the data they need to segment retailers, track SKU penetration, and identify growth opportunities. Book a free demo to see your outlet data transformed into actionable insights.
Sources & References
Frequently Asked Questions
Outlet-wise sales analysis tracks and segments individual retailer purchase data — order frequency, SKU penetration, revenue trends, and growth potential — to drive data-driven decisions about sales deployment, scheme targeting, beat planning, and territory strategy.
By classifying outlets into A/B/C categories based on revenue, frequency, and potential, distributors allocate salesman time and promotional budgets to highest-growth outlets. This focused approach typically drives 15-25% revenue growth from the existing base.
SKU penetration is the percentage of your available product range each outlet purchases. Low penetration indicates massive cross-selling opportunity. Improving from 30% to 50% can increase outlet revenue by 40-60%, making it the highest-ROI growth lever for most distributors.
The analytics system flags outlets with no orders in 30+ days as dormant. Reactivation combines salesman visits, targeted discounts, credit limit reviews, and new product introductions. Typically 50-70% of recently dormant outlets can be reactivated.
You need a distribution management system capturing transaction-level data per outlet, combined with sales analytics and field tracking. SpireStock integrates order management, distribution tracking, attendance monitoring, and analytics into a single platform.
Most distributors see measurable results within 4-6 weeks. Quick wins from dormant outlet reactivation and A-class SKU expansion typically add 10-15% to monthly revenue within the first quarter.
Related SpireStock Features
Powerful dashboards with sales trends, MIS reports, and distribution analytics.
Real-time GPS tracking of vehicles and drivers with route optimization for faster deliveries.
Flexible incentive schemes, flat, bulk-pack, and quantitative, applied automatically.
Related Industries
Streamline FMCG distribution with order management, beat planning, retailer tracking, and GST billing. Built for Indian FMCG supply chains.
Distribution management for consumer goods brands. Manage distributors, retailers, schemes, and sales analytics across India. Start free trial.
End-to-end dairy distribution software for milk, curd, paneer, and ghee brands. Manage orders, crates, cold chain, and GST billing in one platform.
Related Solutions
Track and manage your retail network. Geo-tag outlets, capture secondary sales, manage beats, and monitor retailer performance. Try SpireStock.
Boost field sales team productivity with beat planning, GPS attendance, order capture, and performance analytics. Built for Indian FMCG teams.
Related Entities
Ready to Streamline Your Distribution?
Start your free 30-day trial and see how SpireStock can transform your dairy, FMCG or consumer-goods distribution operation, from order capture to crate recovery.
SpireStock Team
Distribution Technology Experts
SpireStock Team writes for SpireStock on distribution management, supply-chain optimisation and field operations for Indian dairy and FMCG brands.


