Why Distribution Network Design Determines FMCG Success in India
India is home to over 12 million retail outlets, of which approximately 9.5 million sell FMCG products. Reaching these outlets efficiently and profitably is the central challenge of FMCG distribution in India. A well-designed distribution network can mean the difference between a brand that reaches 80% of its target market and one that struggles at 40%.
The numbers tell the story: companies with optimized distribution networks achieve 2-3x higher market penetration at 15-25% lower cost-to-serve compared to those with organically grown, unplanned networks. In a market where brands like Amul, Britannia, and ITC have spent decades building their reach, new entrants and growing brands must design smarter networks to compete.
This guide provides a comprehensive framework for FMCG distribution network planning in India — from first principles of network architecture through territory mapping, distributor density norms, and the technology infrastructure that ties everything together.
Understanding India's Distribution Landscape
Before designing a network, you need to understand the playing field. India's retail landscape is uniquely complex, shaped by geography, urbanization patterns, and consumer behaviour.
Market Segmentation by Geography
| Market Tier | Cities/Towns | Population Range | Est. FMCG Outlets | Average Outlet Monthly Purchase |
|---|---|---|---|---|
| Metro | 8 cities (Mumbai, Delhi, Bangalore, etc.) | 5M+ | 2.2 million | INR 45,000-80,000 |
| Tier-1 | 26 cities | 1M-5M | 1.8 million | INR 25,000-50,000 |
| Tier-2 | ~100 cities | 300K-1M | 1.5 million | INR 15,000-30,000 |
| Tier-3 & below | ~600 towns | 100K-300K | 1.2 million | INR 8,000-18,000 |
| Rural | 6 lakh+ villages | Below 100K | 2.8 million | INR 3,000-10,000 |
Key insight: Rural India accounts for nearly 30% of FMCG outlets but only 36% of FMCG revenue. The per-outlet economics are fundamentally different, requiring distinct network models for urban and rural distribution.
Distribution Network Architecture: The Three Models
Every FMCG distribution network in India is built on one of three foundational models — or a hybrid of them. Choosing the right model depends on your product category, margin structure, volume, and geographic ambitions.
Model 1: Direct Distribution
In the direct model, the company appoints distributors who buy stock directly from the company depot or manufacturing plant. There are no intermediaries.
- How it works: Company → Distributor → Retailer → Consumer
- Best for: Metro and tier-1 cities where volumes justify direct supply; high-margin categories like personal care, premium foods
- Typical cost-to-serve: 8-12% of net sales
- Advantages: Maximum control over pricing, schemes, and freshness; faster market feedback; direct relationship with distributors
- Disadvantages: Requires company-operated depots in each region; higher fixed costs; slow geographic expansion
Companies like Dabur and Haldiram's use direct distribution extensively in metro cities where their depot infrastructure supports it.
Model 2: Super-Stockist (Redistribution) Model
The super-stockist model adds an intermediary layer between the company and local distributors. A super-stockist (also called Carrying and Forwarding Agent or C&F) holds inventory for a region and supplies local distributors.
- How it works: Company → Super-Stockist/C&F → Distributor → Retailer → Consumer
- Best for: Tier-2, tier-3, and rural markets; companies expanding nationally without heavy depot investment; medium-margin categories
- Typical cost-to-serve: 12-18% of net sales (includes super-stockist margin of 2-4%)
- Advantages: Asset-light expansion; leverages local super-stockist relationships and infrastructure; faster geographic rollout
- Disadvantages: Reduced control over secondary distribution; additional margin layer; potential information gaps between company and retail
Model 3: Hybrid Model
Most successful FMCG companies in India eventually adopt a hybrid approach — using direct distribution in high-volume markets and super-stockist networks in lower-volume territories.
- How it works: Direct supply for metro and tier-1 distributors; super-stockist supply for tier-2 and below
- Best for: Companies with national ambitions and a diverse product portfolio
- Typical cost-to-serve: 10-15% blended across geographies
Model Comparison
| Parameter | Direct Distribution | Super-Stockist Model | Hybrid Model |
|---|---|---|---|
| Setup cost per new territory | INR 15-30 lakh | INR 3-8 lakh | INR 8-15 lakh |
| Time to market | 3-6 months | 2-4 weeks | 1-3 months |
| Control over execution | High | Low-Medium | Medium-High |
| Scalability | Slow | Fast | Moderate |
| Data visibility | Real-time | Delayed (1-3 days) | Mixed |
| Ideal for | Metro, Tier-1 | Tier-2, Tier-3, Rural | National coverage |
Territory Mapping Methodology
Once you have chosen your network model, the next step is territory design. Effective territory management ensures that each distributor has a viable, well-defined market to serve without overlap or gaps.
Step 1: Define Geographic Boundaries
Start with administrative boundaries — districts, talukas, or municipal zones — and then refine based on ground realities. In Mumbai, territories might be defined by railway lines (Western, Central, Harbour). In Delhi, they follow colony clusters and market hubs. In smaller cities like Chandigarh or Nagpur, ward-level boundaries work well.
Step 2: Estimate Outlet Universe
For each proposed territory, estimate the total number of FMCG outlets. Use a combination of:
- Government data: Municipal trade license records provide baseline outlet counts
- Industry databases: Nielsen Retail Index, Kantar outlet data
- Field enumeration: Deploy survey teams for ground-truth verification in key territories
- Thumb rules: Urban areas average 1 FMCG outlet per 80-120 population; semi-urban areas 1 per 150-200; rural areas 1 per 250-400
Step 3: Calculate Required Distribution Points
Use the following coverage norms to determine how many distributors each territory needs:
| Market Type | Outlets per Distributor | Outlets per Salesman | Salesmen per Distributor | Population per Distributor |
|---|---|---|---|---|
| Metro | 800-1,200 | 150-200 | 5-7 | 80,000-1,20,000 |
| Tier-1 | 600-900 | 120-180 | 4-6 | 1,00,000-1,50,000 |
| Tier-2 | 400-700 | 100-150 | 3-5 | 1,00,000-2,00,000 |
| Tier-3 | 250-450 | 80-120 | 2-4 | 1,50,000-3,00,000 |
| Rural | 150-300 | 60-100 | 2-3 | 30,000-60,000 |
Key insight: These are starting benchmarks. Adjust based on product category — dairy and beverages need denser networks (20-30% more distribution points) than personal care or home care products due to freshness and frequency requirements.
Step 4: Assess Distributor Economics
Every territory must be economically viable for a distributor. A territory that is too small will not attract quality distributors; one that is too large will not be serviced properly. The viability formula:
- Minimum monthly primary sales: INR 8-12 lakh for metro distributors, INR 4-7 lakh for tier-1 and tier-2, INR 2-4 lakh for tier-3 and rural
- Distributor margin expectation: 4-8% for established brands, 8-12% for emerging brands (read our guide on FMCG distributor margins)
- Working capital requirement: Typically 15-25 days of stock value plus outstanding receivables
- Break-even timeline: A well-designed territory should allow the distributor to break even within 3-4 months
Network Density Planning: Getting the Numbers Right
One of the most common mistakes in FMCG distribution network planning is either over-distributing (too many distributors per territory, leading to channel conflict) or under-distributing (too few, leading to coverage gaps). Here is how to calibrate network density correctly.
The Coverage Pyramid
Think of your distribution network as a pyramid with four layers:
- Layer 1 — National/Regional depots: Company-operated warehouses serving as primary stock points. Typically 4-8 for national coverage (North, South, East, West, Central zones)
- Layer 2 — Super-stockists/C&Fs: Regional redistribution points. 20-40 for national coverage, one per 2-5 districts
- Layer 3 — Distributors: The primary execution arm. 200-2,000+ depending on brand scale and category
- Layer 4 — Sub-distributors/rural stockists: Last-mile extensions for rural and remote areas. 500-5,000+ for deep rural penetration
Benchmarks from Leading Indian FMCG Companies
| Company | Approx. Distributors | Direct Reach (Outlets) | Indirect Reach (Outlets) | Network Model |
|---|---|---|---|---|
| Hindustan Unilever | 3,500+ | 3.5 million | 9 million+ | Hybrid with Project Shakti |
| ITC (FMCG) | 2,800+ | 2.5 million | 6 million+ | Hybrid with e-Choupal legacy |
| Britannia | 2,200+ | 2.3 million | 5.5 million+ | Hybrid |
| Dabur | 1,800+ | 1.5 million | 6.8 million+ | Super-stockist heavy |
| Amul (dairy) | 3,500+ | 1 million+ | NA (cooperative model) | Direct cooperative |
Urban vs Rural Network Design
India's distribution challenge is essentially two different problems — urban and rural — requiring fundamentally different approaches.
Urban Network Design (Metro + Tier-1)
Urban markets like Bangalore, Hyderabad, and Pune are characterized by high outlet density, diverse channel mix (kirana, modern trade, e-commerce), and intense competition.
- Distributor appointment density: 1 distributor per 800-1,200 outlets or per 5-8 sq km in dense urban areas
- Channel specialization: Consider separate distributors for general trade (kirana), modern trade (supermarkets, chain stores), and institutional channels (HoReCa)
- Delivery frequency: Daily or alternate-day delivery for perishables (dairy, bakery); 2-3 times per week for packaged goods
- Technology requirements: GPS-enabled distribution tracking, real-time order capture, digital billing with GST compliance
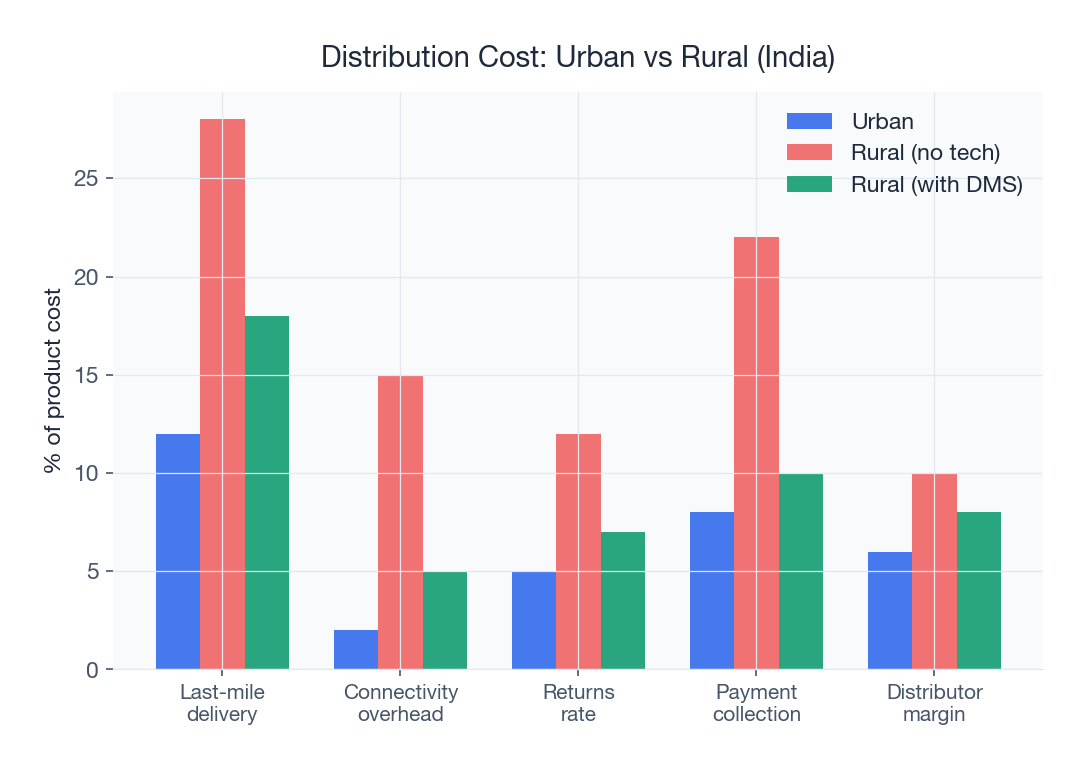
Rural Network Design
Rural India is where distribution gets truly complex. Low outlet density, poor road connectivity, fragmented demand, and limited digital literacy create a unique set of challenges.
- Hub-and-spoke model: Appoint distributors in taluka headquarters (hub) who serve surrounding villages (spokes) through van sales or sub-distributors
- Van sales operations: Deploy dedicated sales vans covering fixed rural routes — typically 1 van per 60-100 villages, visiting each village weekly or fortnightly
- Feeder market strategy: Identify weekly haats (rural markets) and mandis as aggregation points. A single haat can serve as a distribution touchpoint for 15-30 surrounding villages
- Sub-distributor network: Appoint village-level entrepreneurs as sub-distributors — typically shop owners who carry INR 20,000-50,000 of stock and serve their immediate cluster
For companies entering rural markets, multi-plant distribution capabilities become essential to manage the complexity of serving thousands of small order points.
Distributor Appointment Criteria
The quality of your distribution network is only as good as the distributors in it. Having the right distributor appointment criteria prevents costly mistakes. Here is a scoring framework used by leading Indian FMCG companies:
| Criterion | Weight | What to Evaluate |
|---|---|---|
| Financial strength | 25% | Working capital of INR 10-25 lakh (metro) or INR 5-15 lakh (tier-2/3); clean credit history |
| Infrastructure | 20% | Godown of 500-2,000 sq ft; 2+ delivery vehicles; refrigeration (if dairy/frozen) |
| Market knowledge | 20% | 5+ years in local FMCG distribution; existing retail relationships; knowledge of local market dynamics |
| Salesforce readiness | 15% | Existing team of 3-6 salesmen; ability to hire and train additional staff |
| Technology adoption | 10% | Willingness to use digital tools for billing, tracking, and reporting |
| Complementary portfolio | 10% | Carries non-competing FMCG brands; existing outlet coverage aligns with target outlets |
A detailed guide on distributor onboarding best practices can help streamline this process.
Avoiding Channel Conflict
As networks grow, channel conflict becomes inevitable. Common conflict scenarios in Indian FMCG distribution include:
- Territory overlap: Two distributors servicing the same outlets, leading to price undercutting and margin erosion
- Online-offline conflict: E-commerce pricing undercutting traditional distribution partners
- General trade vs modern trade: Modern trade demanding lower prices that traditional distributors cannot match
Conflict Prevention Strategies
- Clear territory demarcation: Use pin code or GPS-boundary-based territory definitions with zero overlap. Distributor management systems can enforce territory boundaries digitally
- Channel-specific pricing: Maintain consistent MRP across channels while varying trade margins and promotional spends
- Exclusive SKU strategy: Offer select pack sizes or variants exclusively through specific channels
- Transparent communication: Share network plans with existing distributors before making changes. The biggest conflicts arise from surprises
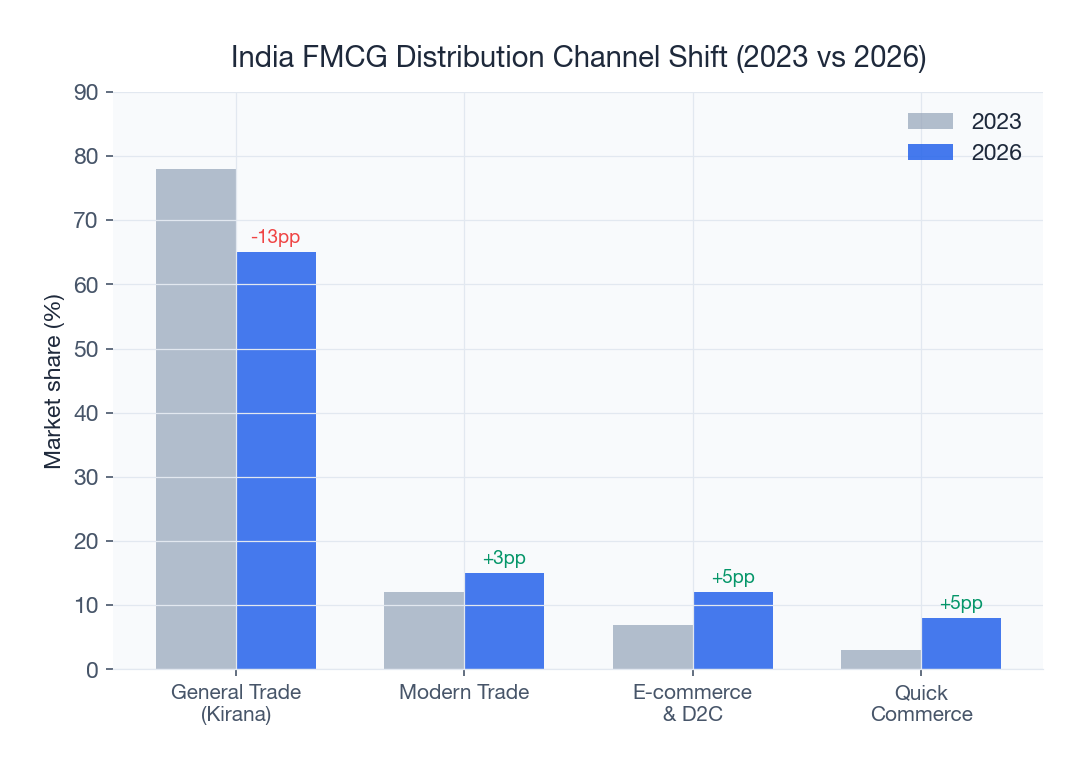
Technology Backbone for Modern Distribution Networks
In 2026, planning a distribution network without a technology backbone is like building a highway without traffic management systems. The digital transformation of Indian FMCG distribution is accelerating, and network planners must build technology into the foundation.
Essential Technology Components
- Distributor Management System (DMS): The central platform that manages primary billing, stock tracking, scheme deployment, and claims processing. Read our comprehensive DMS guide for detailed evaluation criteria
- Sales Force Automation (SFA): Mobile apps for salesmen that handle beat plans, order capture, outlet mapping, and attendance. This is the data collection layer that feeds the entire analytics engine
- Route Optimization: AI-powered route planning that reduces travel time and increases productive calls. Critical for urban markets where traffic adds 30-40% to route times
- Analytics Dashboard: Real-time sales analytics that provide visibility into secondary sales, coverage, productivity, and scheme performance across the network
- Integration Layer: APIs connecting DMS with company ERP, payment gateways, and logistics partners for seamless data flow
Technology Selection Criteria
| Criterion | Why It Matters | Red Flags |
|---|---|---|
| Offline capability | 40% of Indian distributors operate in low-connectivity areas | Cloud-only with no offline sync |
| Multi-language support | Salesmen in different states need local language interfaces | English-only interface |
| Scalability | Network may grow from 50 to 500 distributors | Per-distributor pricing that becomes prohibitive at scale |
| Indian compliance | GST, e-invoicing, TDS — Indian regulations are complex | Built for international markets, retrofitted for India |
| Implementation speed | Faster rollout means faster ROI | 6+ month implementation timelines |
Network Planning Checklist: From Zero to Operational
Here is a step-by-step checklist for brands planning their distribution network in India:
Phase 1: Research and Strategy (Weeks 1-4)
- Market sizing: Estimate total addressable outlets and revenue potential per territory
- Competitive mapping: Identify competitor distribution density and gaps in each market
- Model selection: Choose direct, super-stockist, or hybrid based on margin structure and geographic goals
- Technology partner selection: Evaluate and finalize DMS and SFA platforms
Phase 2: Network Design (Weeks 5-8)
- Territory mapping: Define territories with clear boundaries and outlet counts
- Distributor profiling: Create ideal distributor profiles for each market tier
- Economics modelling: Build territory-wise P&L projections to ensure distributor viability
- Coverage norms: Set salesman-to-outlet ratios and visit frequency targets
Phase 3: Execution (Weeks 9-16)
- Distributor recruitment: Start with top-priority territories; aim for 3-5 candidates per territory to negotiate from strength
- Technology deployment: Set up DMS, configure beat plans, and train distributor teams
- Pilot launch: Go live in 2-3 territories to validate the model before national rollout
- Performance benchmarking: Establish KPIs — coverage %, productive calls, order fulfilment rate, and secondary sales value
Phase 4: Scale and Optimize (Ongoing)
- Territory refinement: After 90 days, re-evaluate territory boundaries based on actual performance data
- Network densification: Add distributors in high-growth territories; consolidate in underperforming ones
- Channel expansion: Layer on modern trade, e-commerce, and institutional channels once general trade is stable
- Continuous monitoring: Monthly reviews of coverage, sales, and distributor health scores
The Economics of Network Scale: When to Expand
Knowing when to add more distributors versus deepening existing ones is a critical strategic decision. The signals are different depending on your current stage of network maturity.
Signals That You Need More Distributors
- Coverage saturation: When existing distributors consistently serve 90%+ of their assigned outlets and salesmen have no more capacity for new additions, it is time to split territories
- Delivery delays: If order-to-delivery time exceeds 24 hours in urban markets or 48 hours in semi-urban, your distribution points are too spread out. Adding distributors closer to retail clusters reduces transit time
- Category expansion: When you launch a new product category (say, adding frozen products to a dry goods portfolio), existing distributors may lack cold chain infrastructure. Category-specific distributors may be needed in cities like Chennai and Kolkata where temperature control is critical year-round
- Competitive pressure: If a competitor is gaining share in specific micro-markets, adding a focused distributor with strong local relationships can be the fastest countermove
Signals to Deepen Rather Than Expand
- Low effective coverage: If existing distributors serve only 50-60% of outlets in their territories, adding more distributors creates overlap without solving the root productivity problem
- Poor per-outlet billing: When average bill values are below benchmark (under INR 2,000 for general trade), the issue is selling depth, not geographic reach. Focus on SKU penetration and salesman training
- High distributor attrition: If you are losing 15%+ distributors annually, the territories are likely not viable. Fix economics before adding more distribution points
Common Network Planning Mistakes to Avoid
Based on our experience working with hundreds of FMCG brands across India, here are the most costly mistakes in distribution network planning:
- Appointing too many distributors too fast: Leads to territory overlap, channel conflict, and weak distributor economics. Start lean and densify based on demand — learn more about why distributors fail
- Ignoring distributor economics: If a territory cannot support INR 4-5 lakh monthly primary sales, the distributor will not invest in infrastructure or salesforce. You will get a name-plate distributor, not a working one
- Uniform network design: Applying Mumbai's distribution model to Kolkata or rural Rajasthan will fail. Each market tier needs a tailored approach
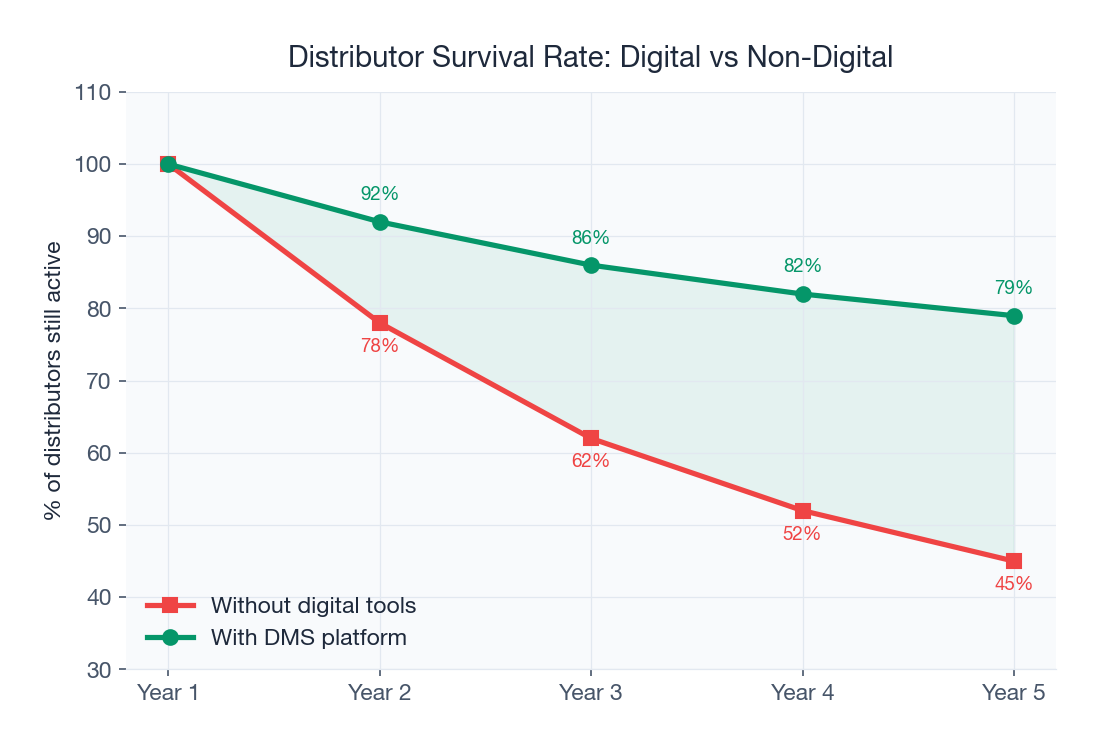
- Neglecting the technology layer: Manual networks have a coverage ceiling. Without digital tools, you cannot scale beyond 200-300 distributors without losing visibility and control
- Underinvesting in training: A new distributor's sales team needs 2-4 weeks of product and process training before they become productive. Skipping this delays the entire revenue ramp
- Ignoring seasonality: Network capacity that works perfectly in lean months may buckle during peak seasons like Diwali, summer, or wedding months. Plan for 20-30% surge capacity, especially for beverage and dairy categories where summer volumes can double
The SpireStock Advantage for Network Planning
SpireStock's distributor management platform is designed for the complexities of Indian FMCG distribution. Our multi-tenant workspace architecture allows brands to manage their entire distribution network — from super-stockists to last-mile sub-distributors — on a single platform.
Key capabilities for network planners include real-time distribution tracking, territory-wise sales analytics, route optimization, and the flexibility to support direct, super-stockist, and hybrid distribution models on the same system.
Whether you are starting a new distribution business or redesigning an existing network for better efficiency, our team can help. Schedule a consultation with our distribution network experts, or explore our pricing plans to find the right fit for your scale.
Sources & References
Frequently Asked Questions
It depends on scale and category. A regional brand might need 50-200 distributors, while national players like HUL operate with 3,500+. Use the benchmark of 800-1,200 outlets per distributor in metros and 250-450 in tier-3 towns to calculate your requirement.
In direct distribution, the company supplies distributors from its own depot. In the super-stockist model, a regional intermediary holds stock and supplies local distributors. Direct offers more control but higher cost; super-stockist enables faster, asset-light expansion.
Metro distributors typically need INR 10-25 lakh working capital, tier-1 and tier-2 distributors need INR 5-15 lakh, and rural stockists need INR 2-5 lakh. This covers 15-25 days of inventory plus receivables from retailers.
In metro markets, 150-200 outlets per salesman is standard. Tier-1 cities aim for 120-180, tier-2 for 100-150, and rural for 60-100. These norms ensure adequate visit frequency while keeping the salesman productive across their beat.
Use GPS-based territory boundaries with pin code or ward-level demarcation. Modern distributor management software enforces boundaries digitally, preventing salesmen from billing outlets outside their assigned territory and eliminating overlap disputes.
Direct distribution setup costs INR 15-30 lakh per territory including depot, while super-stockist models cost INR 3-8 lakh. A hybrid approach averages INR 8-15 lakh. These costs cover infrastructure, initial inventory, and team setup for the first 3 months.
A pilot network of 10-20 distributors can be operational in 8-12 weeks. National rollout with 200+ distributors typically takes 6-12 months. The key is a phased approach — pilot in 2-3 territories, validate the model, then scale systematically.
Essential tools include a Distributor Management System for primary billing and stock tracking, Sales Force Automation mobile apps for beat execution and order capture, route optimization software, and analytics dashboards for network performance monitoring.
Related SpireStock Features
Real-time GPS tracking of vehicles and drivers with route optimization for faster deliveries.
Powerful dashboards with sales trends, MIS reports, and distribution analytics.
Zone, town, and route-based delivery management with optimization.
Related Industries
Streamline FMCG distribution with order management, beat planning, retailer tracking, and GST billing. Built for Indian FMCG supply chains.
Distribution management for consumer goods brands. Manage distributors, retailers, schemes, and sales analytics across India. Start free trial.
Related Solutions
Manage your entire distributor network digitally. Onboarding, credit limits, outstanding tracking, and performance analytics. Start free trial.
Manage distribution across multiple production units and plants. Centralized control with plant-level autonomy for dairy and FMCG brands.
Related Entities
Ready to Streamline Your Distribution?
Start your free 30-day trial and see how SpireStock can transform your dairy, FMCG or consumer-goods distribution operation, from order capture to crate recovery.
SpireStock Team
Distribution Technology Experts
SpireStock Team writes for SpireStock on distribution management, supply-chain optimisation and field operations for Indian dairy and FMCG brands.


