The Margin Reality Check Every Indian Distributor Needs
Ask any FMCG distributor in India about margins and you will hear the same frustration: "Margins are shrinking every year." The headline numbers — 5% here, 8% there — look modest but manageable. The reality is far more nuanced. Between hidden operational costs, retailer credit defaults, scheme complexity, and rising logistics expenses, many distributors are netting just 1-2% after all costs are accounted for.
This guide cuts through the surface-level numbers. We break down actual margin structures across FMCG categories, identify the hidden costs that silently eat into your profits, show you how to calculate true ROI on your distribution business, and demonstrate how technology adoption can improve your net margins by 2-4 percentage points — the difference between a struggling operation and a thriving one.
Whether you are an established FMCG distributor looking to improve profitability or an aspiring entrepreneur evaluating the opportunity (see our guide to starting a distribution business), this data-driven analysis will give you clarity on the real economics of FMCG distribution in India.
FMCG Distributor Margins by Category: The Complete Breakdown
Margins vary dramatically by product category, brand strength, and territory. Here is what distributors actually earn across major FMCG segments in India in 2026.
Margin Comparison Table by Category
| Category | Gross Margin Range | Typical Net Margin | Key Margin Drivers |
|---|---|---|---|
| Dairy Products | 8-15% | 3-6% | Cold-chain costs, spoilage (2-5%), high daily volume |
| Snacks & Namkeen | 5-10% | 2-5% | High demand, moderate returns, seasonal peaks |
| Beverages (Carbonated/Juices) | 6-12% | 2.5-5% | Seasonal, heavy logistics, crate management |
| Personal Care & Home Care | 4-8% | 2-4% | Scheme-heavy, stable demand, low spoilage |
| Packaged Staples (Atta, Oil, Rice) | 3-6% | 1-3% | Volume-driven, thin margins, high competition |
| Bakery & Confectionery | 8-14% | 3-6% | Short shelf life, daily replenishment, returns |
| Health & Wellness | 8-12% | 4-6% | Premium pricing, growing demand, lower competition |
| Frozen Foods | 10-16% | 3-5% | Cold-chain mandatory, growing segment, higher unit value |
Key insight: The gap between gross and net margins is where most distributors lose money without realising it. A dairy distributor earning 12% gross may net only 4% after cold-chain costs, spoilage, and delivery expenses. Understanding this gap is the first step to improving profitability.
What Determines Your Margin Within a Category?
Two distributors in the same city distributing the same brand can have vastly different net margins. The variables include:
- Territory density: A distributor covering 400 outlets within 8 km in central Mumbai has far lower per-delivery costs than one covering 400 outlets spread across 30 km in the outskirts of Nagpur.
- Brand tier: National brands like Amul, Britannia, and ITC offer lower base margins (3-6%) but compensate with volume, scheme incentives, and brand pull. Regional brands offer higher base margins (6-12%) but require more selling effort.
- Scheme utilisation: Distributors who fully understand and claim all available schemes — slab discounts, quantity incentives, seasonal bonuses, display schemes — can add 1-3% to their effective margin. Many distributors leave money on the table simply because they track schemes manually and miss deadlines.
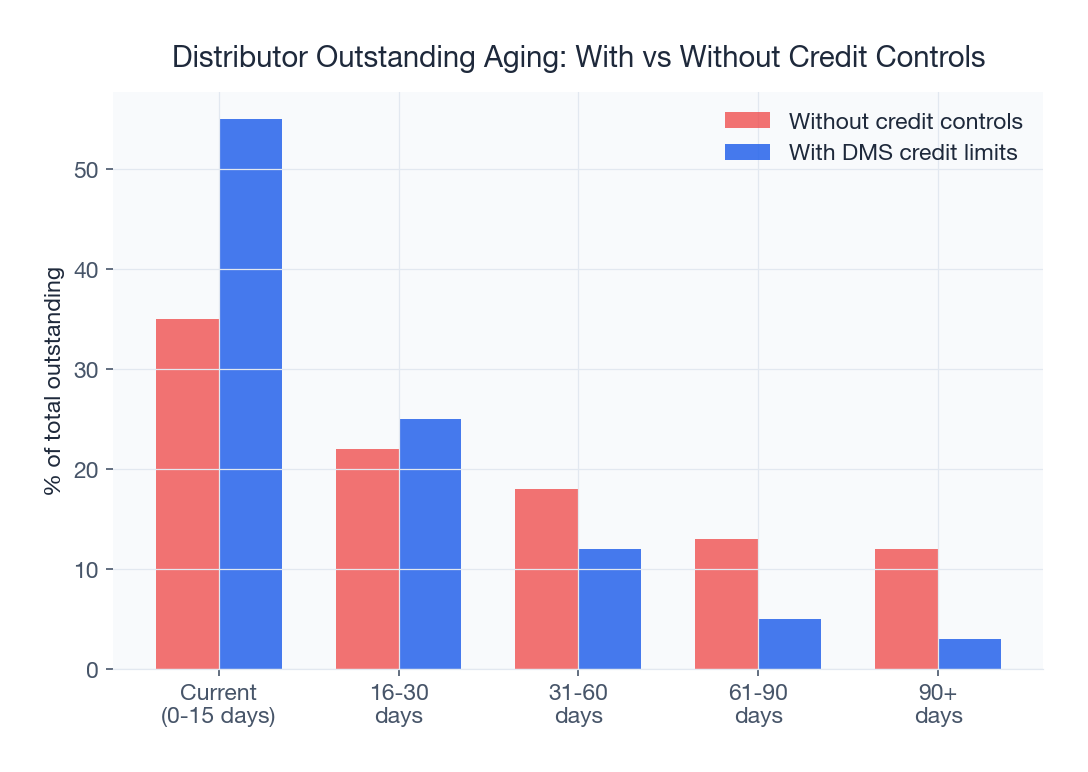
- Credit management: Each day of extra credit you extend to retailers costs you money. At 12% annual cost of capital, 30 days of extra credit on Rs 15 lakh outstanding equals Rs 15,000 per month in implicit cost.
The Hidden Costs Eating Into Your Margins
Most distributors calculate profitability by subtracting purchase cost from selling price. This simplistic calculation ignores a dozen cost centres that cumulatively reduce margins by 3-6 percentage points.
Complete Cost Breakdown for an FMCG Distributor (Rs 20 Lakh Monthly Revenue)
| Cost Centre | Monthly Cost (Rs) | % of Revenue | Visibility |
|---|---|---|---|
| Cost of Goods Sold | 17,60,000-18,80,000 | 88-94% | Obvious |
| Warehouse Rent | 20,000-40,000 | 1-2% | Obvious |
| Staff Salaries | 80,000-1,20,000 | 4-6% | Obvious |
| Vehicle Fuel & Maintenance | 20,000-35,000 | 1-1.75% | Partially tracked |
| Electricity & Utilities | 8,000-15,000 | 0.4-0.75% | Obvious |
| Product Spoilage & Expiry | 10,000-40,000 | 0.5-2% | Often underestimated |
| Retailer Credit Defaults | 5,000-20,000 | 0.25-1% | Often ignored until year-end |
| Cost of Working Capital | 12,000-25,000 | 0.6-1.25% | Invisible to most |
| Product Returns Processing | 5,000-15,000 | 0.25-0.75% | Rarely calculated |
| Billing Errors & Disputes | 3,000-10,000 | 0.15-0.5% | Invisible |
| Crate/Asset Losses | 2,000-8,000 | 0.1-0.4% | Often ignored |
| GST Compliance & Accounting | 5,000-10,000 | 0.25-0.5% | Partially tracked |
Add up the "invisible" and "underestimated" costs — they total Rs 37,000-1,18,000 per month. On Rs 20 lakh revenue, that is 1.8-5.9% of revenue that most distributors do not factor into their margin calculations. This is why a distributor who thinks they are earning 6% is often netting 2-3% in reality.
The Working Capital Cost Most Distributors Ignore
Working capital is not free money. Whether you borrow from a bank at 10-14% interest or use your own funds (which could earn 6-8% in fixed deposits), there is an opportunity cost. A typical FMCG distributor has Rs 8-15 lakh locked in receivables and inventory at any time. At 12% cost of capital, that is Rs 8,000-15,000 per month — a hidden cost that directly reduces your net margin.
Efficient payment collection reduces your average receivable days. Every 5-day reduction in collection time frees up approximately Rs 1-2 lakh in working capital, saving Rs 1,000-2,000 per month in implicit costs. It sounds small, but these savings compound across every cost centre.
How to Calculate Your True Distribution ROI
Most distributors evaluate their business using gross margin percentage. This is dangerously misleading. Here is a more accurate framework.
True ROI Formula for Distributors
True Monthly Net Profit = Gross Margin + Scheme Income - All Operating Costs (visible + hidden) - Cost of Capital
True ROI = (Annual Net Profit / Total Capital Deployed) x 100
Example: Snacks Distributor in Pune
- Monthly Revenue: Rs 18 lakh
- Gross Margin (7%): Rs 1,26,000
- Scheme Income (1.5% effective): Rs 27,000
- Total Gross Income: Rs 1,53,000
- Visible Operating Costs: Rs 95,000
- Hidden Costs (spoilage, defaults, capital cost, errors): Rs 28,000
- True Net Profit: Rs 30,000 per month (1.67% net margin)
- Capital Deployed: Rs 22 lakh
- True Annual ROI: 16.4%
A 16.4% ROI on capital is respectable — better than most fixed-income investments — but it requires significant daily effort and carries business risk. The question becomes: how do you move that ROI from 16% to 24% or higher? The answer lies in attacking the controllable cost centres.
Comparing ROI Across City Tiers
Distribution economics shift significantly between metros, Tier-2, and Tier-3 cities. A distributor in Bangalore may achieve Rs 35-50 lakh in monthly revenue but faces warehouse rents of Rs 50,000-80,000, staff costs 30-40% higher than smaller cities, and intense competition from 3-5 other distributors in the same territory for the same brand. The net result is often a 12-16% ROI on capital.
In contrast, a distributor in a Tier-3 city like Hubli, Raipur, or Gorakhpur operates with Rs 10-15 lakh monthly revenue but warehouse rent of Rs 8,000-15,000, lower staff costs, and often exclusive or semi-exclusive territory rights. The ROI can reach 20-30% despite lower absolute profits. This is why many experienced distribution entrepreneurs deliberately avoid metros and build multi-city operations across 3-5 Tier-2 and Tier-3 towns. For network planning strategies, explore our FMCG distribution network planning guide.
Category Deep Dive: Dairy Distribution Margins
Dairy distribution offers some of the highest gross margins in FMCG but also the highest operational complexity. Brands like Amul, Mother Dairy, and Heritage Foods offer 8-15% margins on their product ranges.
Why Dairy Margins Are High But Tricky
- Cold chain costs: Refrigerated vehicles and cold-room storage add Rs 15,000-30,000 monthly. This alone can eat 1-2% of your margin.
- Spoilage risk: Dairy products have shelf lives of 2-15 days. Even a 3% spoilage rate on a Rs 25 lakh monthly volume costs Rs 75,000 — wiping out a significant chunk of your margin.
- Daily delivery requirement: Unlike FMCG staples where you can deliver twice a week, dairy demands daily or twice-daily delivery, increasing fuel and labour costs.
- Returns management: Expired and near-expiry returns are a daily reality. Without proper distribution tracking, returns can spiral to 4-6% of volume.
Despite these challenges, dairy distribution remains attractive because of consistent daily demand, strong brand pull (consumers specifically ask for Amul or Country Delight), and the compounding effect of high turnover on thin-looking margins. A 5% net margin on Rs 30 lakh monthly dairy revenue is Rs 1.5 lakh per month — a solid income. Read our complete dairy distribution software guide for technology solutions specific to this category.
How Technology Improves Net Margins by 2-4%
This is the most actionable section of this guide. We have analysed data from hundreds of distributors using SpireStock's platform and consistently see net margin improvements of 2-4 percentage points after technology adoption. Here is exactly where those gains come from.
Margin Improvement Breakdown Through Technology
| Cost Centre | Before Technology | After Technology | Margin Impact |
|---|---|---|---|
| Billing Errors & Disputes | 0.3-0.5% of revenue | Under 0.05% | +0.25-0.45% |
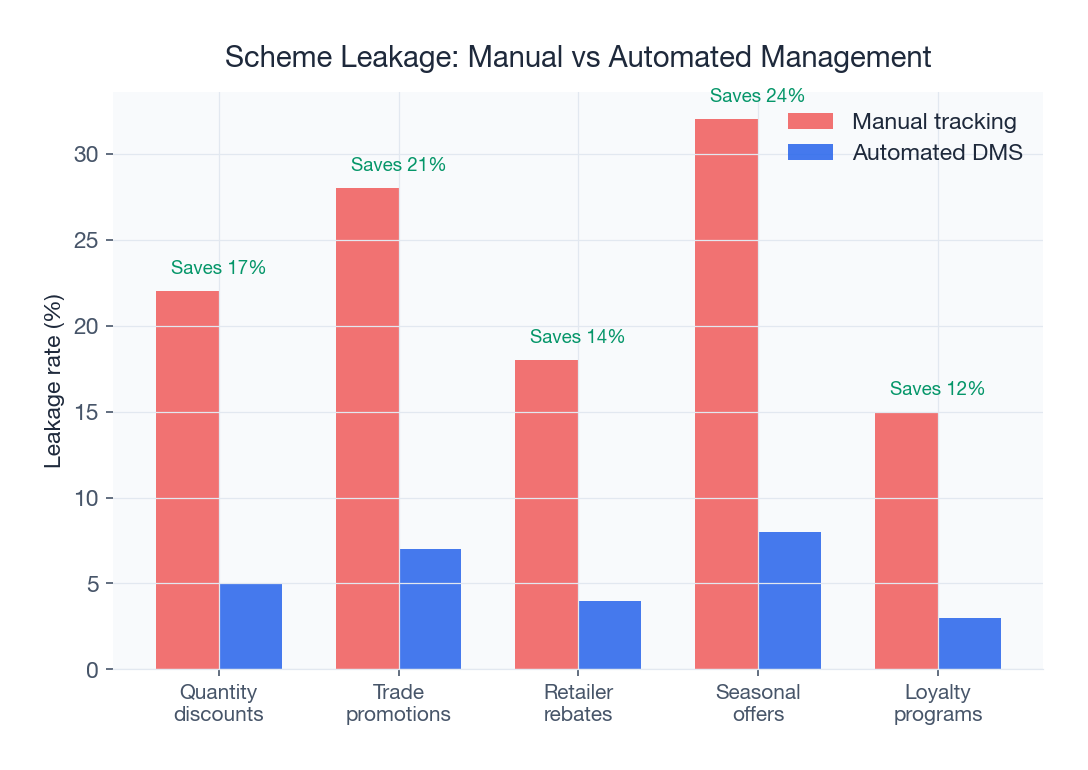
| Scheme Leakage (unclaimed incentives) | 30-50% schemes missed | Under 5% missed | +0.5-1.5% |
| Delivery Efficiency (fuel, time) | 20-25 stops/day | 30-40 stops/day | +0.3-0.6% |
| Spoilage & Expiry Losses | 2-5% of perishable stock | 0.5-1.5% | +0.3-0.8% |
| Collection Efficiency | 70-80% on time | 90-95% on time | +0.2-0.5% |
| Staff Productivity | 20-25 outlet visits/day | 30-40 visits/day | +0.3-0.5% |
Total potential improvement: 1.85-4.35% of revenue
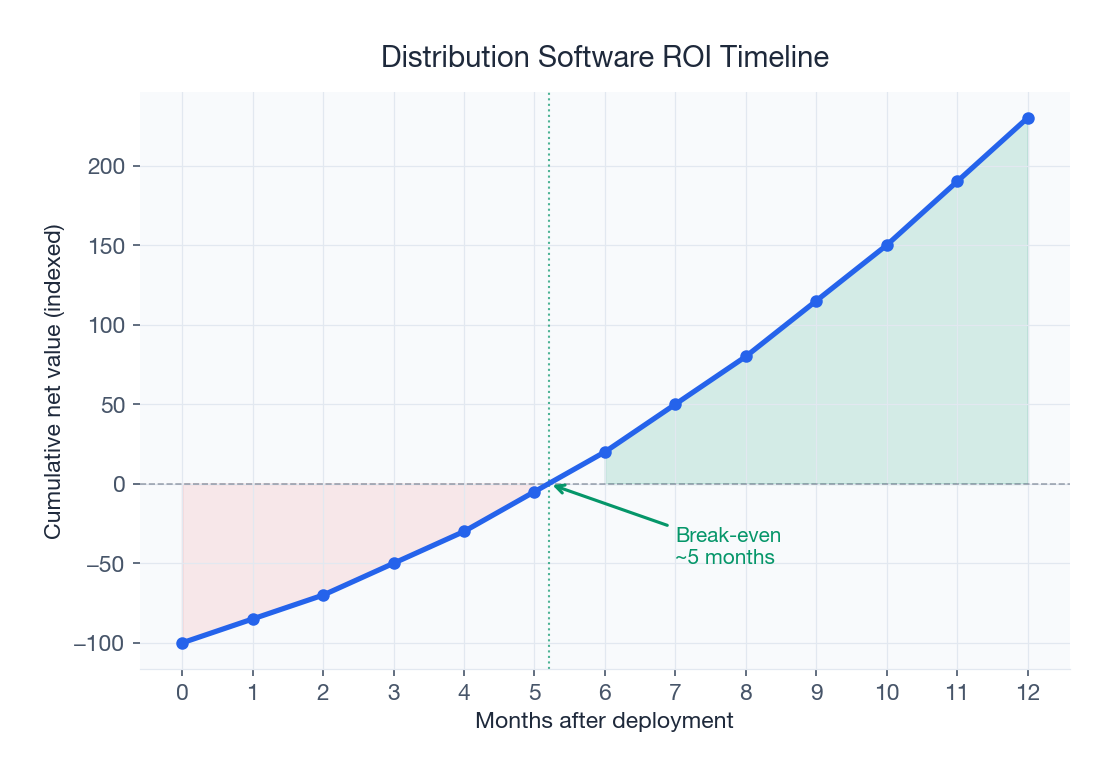
On Rs 20 lakh monthly revenue, a 3% margin improvement equals Rs 60,000 additional monthly profit — or Rs 7.2 lakh annually. Against a software cost of Rs 3,000-8,000 per month (Rs 36,000-96,000 annually), the ROI on technology investment is 750-2000%.
Case Study: Margin Transformation at a Mid-Size FMCG Distributor
A snacks and confectionery distributor in Coimbatore distributing products from Haldiram's and two regional brands was struggling with 1.8% net margins on Rs 22 lakh monthly revenue — barely Rs 40,000 per month in profit.
Problems Identified
- Scheme tracking: They were missing 40% of available scheme claims because of manual record-keeping. Lost income: approximately Rs 13,000/month.
- Billing errors: 6% of invoices had errors requiring correction, causing disputes and delayed payments. Cost: Rs 8,000/month in write-offs and processing time.
- Route inefficiency: Drivers were covering 120 km daily when optimised routes could achieve the same deliveries in 80 km. Excess fuel cost: Rs 6,000/month.
- Expiry losses: 3.5% of stock was expiring or being returned unsold because of poor FIFO compliance. Loss: Rs 25,000/month.
- Collection delays: Average receivable days were 28 against a 15-day target. Working capital cost: Rs 12,000/month.
After Technology Adoption
Within four months of implementing a comprehensive distribution management system with scheme management, automated billing, route optimization, and sales analytics:
- Scheme claims: Increased to 95% capture rate. Recovered Rs 11,000/month.
- Billing accuracy: Errors dropped to 0.3%. Saved Rs 7,000/month.
- Route efficiency: Daily kilometres reduced by 30%. Saved Rs 5,500/month.
- Expiry losses: Dropped to 1.2% with automated FIFO alerts. Saved Rs 17,000/month.
- Collection days: Reduced from 28 to 16 days. Saved Rs 8,000/month in capital cost.
Total monthly improvement: Rs 48,500. Net margin improved from 1.8% to 4.0%. Monthly profit nearly tripled from Rs 40,000 to Rs 88,500 — against a software cost of Rs 5,000/month. The payback period was under two weeks.
Strategies to Maximise Your Distribution Margins
Beyond technology, here are proven strategies that top-performing Indian distributors use to protect and grow their margins.
1. Master Scheme Management
FMCG brands run dozens of schemes — slab discounts, cash discounts, quantity incentives, display schemes, seasonal bonuses, and trade promotions. A distributor handling 3-4 brands may have 20-30 active schemes at any time. Without a dedicated scheme engine, you are guaranteed to miss claims. The most disciplined distributors treat scheme income as a separate P&L line item and assign someone to track every scheme deadline and eligibility criterion. Read our complete scheme management guide for detailed strategies.
2. Tighten Credit Policies Ruthlessly
The difference between a 20-day average collection period and a 35-day period is massive. On Rs 20 lakh monthly sales, 15 extra days of credit means Rs 10 lakh additional working capital tied up — costing Rs 10,000-12,000 per month at market rates. Segment your retailers: cash-on-delivery for small outlets, 7-day credit for medium ones, and 15-21 days only for your top-volume accounts with proven payment history.
3. Optimise Your Product Mix
Not all SKUs earn equal margins. Within any brand portfolio, some products carry 4% margin while others carry 10%. Use sales analytics to identify your highest-margin SKUs and actively promote them to retailers. A deliberate shift of even 10% of your volume toward higher-margin products can improve overall margins by 0.5-1%.
4. Reduce Returns and Spoilage
Returns and spoilage are the silent margin killers. For bakery and confectionery distributors, returns can reach 5-8% of volume. Implement strict FIFO inventory management, negotiate realistic shelf-life minimum requirements with brands, and use demand forecasting to avoid overstocking slow-moving SKUs.
5. Negotiate Volume-Based Terms
As your volumes grow, you gain negotiating leverage. Push for better payment terms from brands (moving from advance payment to 7-day credit saves you working capital), lower minimum order quantities for slow-moving SKUs, and higher scheme slabs. Documented sales data from your distribution management system gives you credibility in these negotiations.
6. Multi-Brand Strategy for Margin Diversification
Relying on a single brand is risky — one policy change can slash your margins overnight. Top distributors in cities like Kolkata, Lucknow, and Surat handle 3-5 complementary brands across different subcategories. This diversifies margin risk and increases revenue per retailer visit, improving overall route economics.
The ideal multi-brand portfolio combines a high-volume, low-margin anchor brand (like Britannia biscuits or Dabur juices) with 2-3 higher-margin regional or niche brands. Your anchor brand guarantees retailer access and route viability — every kirana store stocks these products. Your supplementary brands ride the same delivery route at near-zero incremental cost, and their higher margins (often 8-12%) dramatically improve your blended profitability. A distributor running Rs 15 lakh in anchor brand revenue at 4% net and Rs 8 lakh in supplementary brands at 8% net earns Rs 1.24 lakh monthly — compared to Rs 60,000 if they distributed only the anchor brand.
7. Leverage Rural and Semi-Urban Expansion
As urban markets become saturated and competitive, margins in Tier-1 cities are under constant pressure. Distributors who extend their reach into semi-urban and rural territories — what the industry calls "going deeper" — often discover better margin environments. Competition is thinner, retailers are more loyal, and brands offer additional incentives for rural penetration. Our rural FMCG distribution guide covers the specific challenges and strategies for serving these markets profitably.
Industry Outlook: Where FMCG Distributor Margins Are Heading
Several macro trends are reshaping distributor economics in India:
- Direct-to-retailer models: Some brands are experimenting with bypassing distributors for top modern-trade accounts. This threatens volume but may improve margins on remaining outlets where the distributor adds irreplaceable value.
- Quick commerce impact: Platforms like Blinkit, Zepto, and Swiggy Instamart are capturing urban demand that previously went through traditional retail. Distributors serving primarily urban kirana stores in metros need to diversify.
- Technology expectations: Brands increasingly require digital reporting, real-time stock visibility, and automated scheme compliance. Distributors without technology will lose brand appointments to digitally-enabled competitors. This is why understanding distribution cost reduction strategies is essential for long-term survival.
- Rising operational costs: Fuel, rent, and labour costs are increasing 5-8% annually. Without corresponding margin improvements through efficiency, net margins will compress further.
The distributors who will thrive in this environment are those who treat distribution as a technology-enabled logistics and sales operation rather than a traditional trading business. Margins will remain tight, but efficient operators can consistently earn 4-6% net — a strong return when applied to the high-turnover, asset-light nature of distribution.
Take Control of Your Margins Today
The difference between a distribution business that earns 1.5% net and one that earns 4.5% net is not luck — it is operational discipline powered by the right tools. Every billing error you prevent, every scheme you claim, every unnecessary kilometre you eliminate, and every collection you accelerate adds directly to your bottom line.
SpireStock is built to help Indian distributors capture every rupee of margin they earn. Our scheme engine ensures you never miss an incentive claim. Our billing system eliminates errors. Our route optimization cuts delivery costs. And our analytics dashboard shows you exactly where your money is going — and where you can get more of it back.
Schedule a free margin analysis with our distribution experts, or explore our plans to see how quickly the software pays for itself at your revenue scale.
Sources & References
Frequently Asked Questions
Gross margins range from 3-6% for packaged staples to 8-15% for dairy and frozen foods. After accounting for all operational costs including hidden expenses, net margins typically settle at 1.5-5% depending on category, territory efficiency, and technology adoption.
A mid-sized FMCG distributor with Rs 15-25 lakh monthly revenue typically nets Rs 30,000-1 lakh per month after all costs. Larger distributors handling Rs 50 lakh or more monthly can earn Rs 2-4 lakh. Exact earnings depend on category margins and operational efficiency.
Intense competition, brand-controlled pricing, rising operational costs, and retailer credit demands compress margins. Additionally, hidden costs like spoilage, billing errors, scheme leakage, and working capital interest reduce apparent margins by 2-4 percentage points below gross figures.
Dairy products (8-15% gross), frozen foods (10-16% gross), and bakery items (8-14% gross) offer the highest margins but also carry higher operational costs due to cold-chain requirements and perishability. Health and wellness products (8-12%) offer strong margins with lower complexity.
The most effective strategies include adopting DMS software to reduce operational waste, maximising scheme claims through systematic tracking, tightening credit policies to reduce working capital costs, optimising delivery routes, and shifting product mix toward higher-margin SKUs.
Major hidden costs include working capital interest (0.6-1.25% of revenue), spoilage and expiry losses (0.5-2%), billing errors (0.15-0.5%), unclaimed scheme incentives (0.5-1.5%), and collection defaults (0.25-1%). Together these can reduce margins by 2-6 percentage points.
DMS software improves margins by 2-4 percentage points through automated scheme tracking, error-free billing, route optimization for fuel savings, FIFO-based inventory management to reduce spoilage, and faster payment collection. The ROI on software investment typically exceeds 750%.
Yes, but only for operationally efficient distributors. The market continues to grow at 8-10% annually, and distributors who adopt technology, manage costs tightly, and diversify across 3-5 complementary brands can consistently earn 4-6% net margins with strong returns on capital.
Related SpireStock Features
Powerful dashboards with sales trends, MIS reports, and distribution analytics.
Flexible incentive schemes, flat, bulk-pack, and quantitative, applied automatically.
GST-compliant invoicing with HSN codes, gate passes, and financial ledger.
Related Industries
Streamline FMCG distribution with order management, beat planning, retailer tracking, and GST billing. Built for Indian FMCG supply chains.
End-to-end dairy distribution software for milk, curd, paneer, and ghee brands. Manage orders, crates, cold chain, and GST billing in one platform.
Related Solutions
Track distributor and retailer payments. Cash, UPI, cheque collection with reconciliation, ageing reports, and credit limit management.
Manage your entire distributor network digitally. Onboarding, credit limits, outstanding tracking, and performance analytics. Start free trial.
Related Entities
Ready to Streamline Your Distribution?
Start your free 30-day trial and see how SpireStock can transform your dairy, FMCG or consumer-goods distribution operation, from order capture to crate recovery.
SpireStock Team
Distribution Technology Experts
SpireStock Team writes for SpireStock on distribution management, supply-chain optimisation and field operations for Indian dairy and FMCG brands.


