Why MIS Reports Matter for Indian Distributors
In Indian FMCG distribution, the difference between a thriving business and a struggling one often comes down to information. Distributors who know exactly what is selling, where money is stuck, which salesmen are underperforming, and which schemes are working, make better decisions and grow faster. Those operating on gut feel and delayed data fall behind.
Management Information System (MIS) reports are the backbone of this decision-making capability. Yet for the vast majority of Indian distributors, especially those in Lucknow, Surat, Kolkata, and other tier-2 cities, MIS remains a painful manual exercise: salesmen filling paper forms, back-office staff keying data into Excel, and reports reaching management 24-48 hours after the day has ended. By then, the information is history, not intelligence.
This guide covers every MIS report that Indian FMCG and dairy distributors need, compares the manual and automated approaches, and shows how a modern distributor management system transforms reporting from a burden into a competitive advantage. For context on what distribution management software looks like, start with our explanation of what a DMS is.
The 12 Essential Distributor MIS Reports
Based on working with hundreds of Indian distributors across FMCG, dairy, and beverage distribution, here are the reports every distributor needs, organized by frequency and purpose.
1. Daily Sales Report (DSR)
The DSR is the single most important operational report. It captures the day's sales performance broken down by salesman, product, beat, and value. A good DSR answers: Did we hit today's target? Which salesmen delivered? Which products moved? Which territories underperformed?
In manual systems, the DSR depends on salesmen submitting their daily summaries, which may arrive late, contain errors, or omit inconvenient details. With automated sales analytics, the DSR is generated in real time as orders are placed and invoiced. By 7 PM, the complete DSR is available on your dashboard without any manual compilation.
2. Stock Position Report
This report shows current inventory levels across all product SKUs, including opening stock, receipts, dispatches, returns, damages, and closing stock. For dairy distributors, it also includes batch-wise breakdown with expiry dates, which is critical for FIFO enforcement and minimizing wastage.
Manual stock reports are notoriously inaccurate. Physical stock counts done weekly or monthly always reveal discrepancies with register-based records. Automated distribution tracking maintains perpetual inventory that updates with every transaction, giving you accurate stock position at any moment. Read more about inventory best practices in our inventory management guide for distributors.
3. Outstanding Receivables Report
Cash flow is the lifeline of distribution, and this report tracks every rupee owed by every retailer. It should show current outstanding, ageing analysis (0-7 days, 8-15 days, 16-30 days, 30+ days), credit limit utilization, and payment history patterns.
In manual systems, outstanding data lives in ledger books or Tally entries that are reconciled weekly at best. Automated systems update outstanding in real time as invoices are raised and payments are collected. For more on managing credit effectively, see our guide on credit limit management for FMCG distributors.
4. Salesman Performance Report
This report tracks each salesman's productivity metrics: total calls made, productive calls (where an order was placed), total order value, average bill value, new outlets added, collection amount, and target achievement percentage. Combined with attendance tracking data, it gives a complete picture of field force effectiveness.
When a salesman in Mumbai is making 15 productive calls per day while his colleague manages 28, you need to know, and you need to know today, not at the end of the month. Automated tracking through the mobile app captures this data as it happens. Our salesman tracking guide covers this in detail.
5. Scheme Utilization Report
Trade schemes drive FMCG sales, but without tracking, you cannot know which schemes are effective and which are wasting money. This report shows scheme-wise utilization rates, retailer participation, incremental sales generated, and cost per incremental unit sold.
The scheme engine automatically tracks every scheme application, making this report effortless. Without automation, scheme analysis is almost impossible because the data is scattered across hundreds of manual invoices. See our scheme management guide for best practices.
6. Return and Damage Analysis
Returns eat into margins and signal operational problems. This report tracks return quantities and values by product, reason (expiry, damage, quality, wrong delivery), retailer, and trend over time. For dairy distributors, returns due to expiry are a direct measure of demand forecasting accuracy.
7. Beat-wise Sales Report
This report aggregates sales data by geographic beat or territory, showing which areas are growing, stagnating, or declining. It is essential for beat restructuring decisions, territory rebalancing, and resource allocation. Distributors in cities like Bangalore and Hyderabad with rapidly expanding geographies need this report monthly.
8. Product-wise Sales Analysis
Breaking down sales by product or SKU reveals fast movers, slow movers, and products with declining trajectories. Combined with margin data, it helps distributors prioritize high-margin products and identify SKUs that should be de-listed. This analysis feeds directly into demand forecasting accuracy.
9. Collection Efficiency Report
This report measures how effectively your collection process works: total billed amount versus collected amount per period, collection percentage by salesman and territory, and ageing movement (how much of the 15-day bucket moved to 30-day, and vice versa). Improving collection efficiency from 75% to 90% can free up crores in working capital. See our payment collection guide for strategies.
10. Credit Limit Utilization Report
Tracks how much of each retailer's assigned credit limit is being used. Retailers consistently at 90-100% utilization may need limit increases to support growth, while those at 20-30% may indicate relationship problems or declining business.
11. Vehicle/Delivery Performance Report
Tracks delivery metrics per vehicle: drops completed, distance covered, fuel consumption, on-time delivery percentage, and capacity utilization. Essential for fleet management optimization and cost control.
12. GST and Tax Summary Report
A compliance-critical report that summarizes tax liability, input credits, HSN-wise sales, and data needed for GSTR-1, GSTR-3B, and annual return filing. Automated invoicing generates this data as a by-product of normal billing operations.
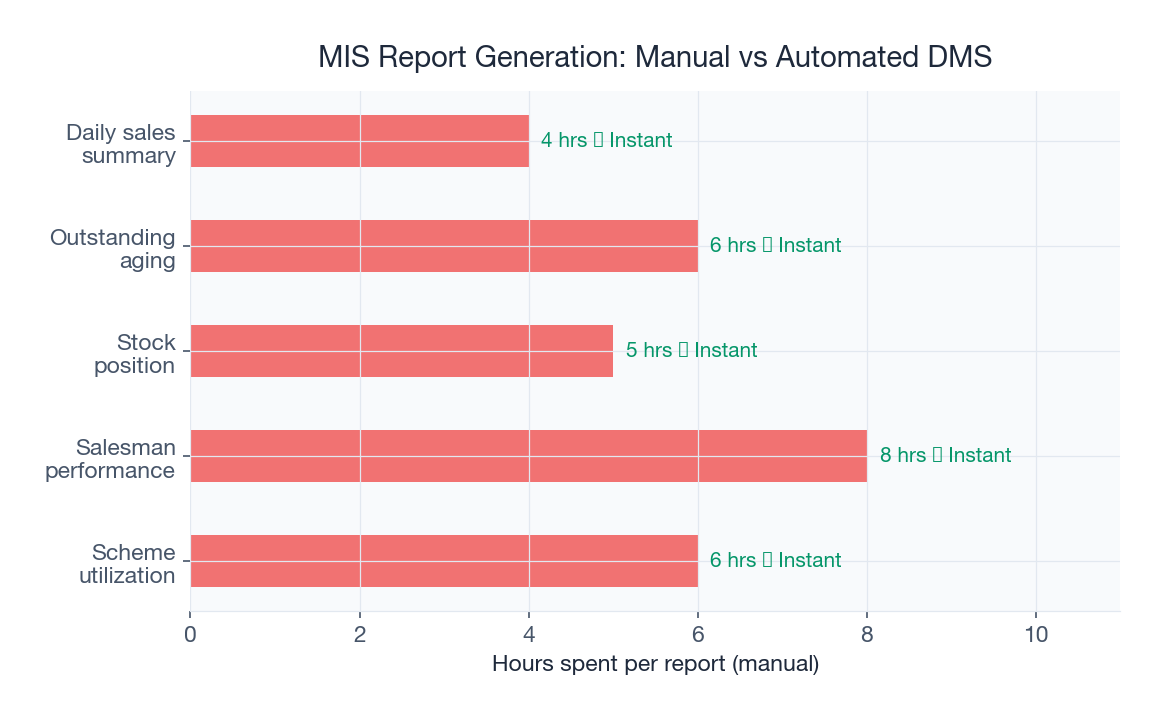
Manual vs Automated MIS: The Real Cost Comparison
Here is a side-by-side comparison of manual and automated MIS for a distributor handling 400 retail outlets with 6 salesmen:
| Parameter | Manual MIS | Automated MIS (DMS) |
|---|---|---|
| Daily preparation time | 3-5 hours | 0 hours (real-time) |
| Data accuracy | 70-85% | 99%+ |
| Report availability | Next day (or later) | Real-time dashboard |
| Monthly consolidation | 2-3 days of staff time | Instant (auto-generated) |
| Staff needed for reporting | 1-2 dedicated staff | 0 (self-service) |
| Annual cost of reporting | Rs 3-5 lakh (staff + time) | Included in DMS subscription |
| Custom report capability | Very limited (Excel skills) | Flexible filters and drill-downs |
| Historical trend analysis | Painful (digging through files) | One-click comparison periods |
| Error rate in reports | 5-15% | <1% |
The annual cost differential is significant, but the real cost of manual MIS is not the labour. It is the decisions you cannot make because data arrives too late, too inaccurate, or in too fragmented a form. For a thorough analysis of manual versus digital approaches, read manual vs digital distribution management.
How a DMS Generates MIS Reports Automatically
Understanding the mechanism helps distributors appreciate why automated MIS is not just faster but fundamentally more reliable. Here is how the data flow works in a modern distributor management system:
- Order capture: Retailer or salesman places order via mobile app. The system records order details, timestamp, location, and salesman identity automatically.
- Invoice generation: Auto-invoicing creates the bill with correct pricing, schemes, taxes, and terms. Every invoice becomes a data point in 6+ MIS reports simultaneously.
- Dispatch and delivery: Distribution tracking records what was dispatched, when, in which vehicle, and delivery confirmation with digital proof.
- Payment recording: Collections are logged in real time with payment mode, amount, and retailer mapping. Outstanding reports update instantly.
- Analytics engine: The analytics engine aggregates all this transactional data into structured reports, dashboards, and trend analyses, available instantly without any manual compilation.
Because every transaction is captured digitally at the point of origin, there is no data entry step, no transcription errors, and no delays. The MIS is a living, real-time reflection of your business.
Making Data-Driven Decisions: From Reports to Actions
Having MIS reports is valuable only if they drive action. Here are the most impactful decisions Indian distributors can make using automated MIS data:
Beat Restructuring
Beat-wise sales reports often reveal that 30% of beats generate 70% of revenue. Distributors in Delhi and Pune have restructured beats based on MIS data, increasing productive calls per day by 25-35% and reducing cost-to-serve for low-value territories.
Credit Limit Optimization
Outstanding reports with ageing analysis enable dynamic credit limit management. Instead of static limits set once a year, distributors adjust limits quarterly based on payment patterns, growing limits for reliable retailers and tightening for chronic defaulters.
Salesman Incentive Design
Performance reports with multi-dimensional metrics (not just total sales) enable better incentive structures. Rewarding productive call rates, collection efficiency, and new outlet additions alongside revenue drives the right behaviors. The sales productivity solution provides the data foundation for these programs.
Scheme ROI Analysis
Scheme utilization reports reveal which promotions generate incremental sales and which merely shift timing. A distributor in Chennai discovered through MIS analysis that 3 of their 8 active schemes generated negative ROI, costing more in discounts than they generated in incremental profit. Eliminating those schemes saved Rs 4.5 lakh annually.
SKU Rationalization
Product-wise analysis identifies the bottom 20% of SKUs that consume disproportionate shelf space, warehousing cost, and management attention. Distributors who rationalize based on MIS data typically see 5-8% improvement in inventory turnover.
Getting Started with Automated MIS
The transition from manual to automated MIS does not require a big-bang implementation. Most distributors follow this path:
- Week 1-2: Set up order management and billing automation. The DSR and stock reports become available immediately.
- Week 3-4: Onboard salesmen on the mobile app. Salesman performance and beat-wise reports activate.
- Month 2: Configure scheme tracking and outstanding management. Scheme utilization and receivables reports go live.
- Month 3: Full MIS suite operational with historical data for trend analysis.
Within 90 days, you go from spending 3-5 hours daily on manual reporting to having a complete, real-time MIS dashboard that updates itself. Explore our features checklist to evaluate what capabilities matter most for your operation, or contact us for a personalized demo. Check our pricing plans to see how affordable automated MIS can be for your distribution business.
Sources & References
Frequently Asked Questions
The essential MIS reports are: Daily Sales Report (DSR), stock position/inventory report, outstanding receivables report, salesman performance report, scheme utilization report, return and damage analysis, beat-wise sales report, product-wise sales analysis, credit limit utilization report, and collection efficiency report. Together, these cover the operational, financial, and strategic dimensions of distribution management.
A typical mid-sized Indian distributor with 300-600 retail outlets spends 3-5 staff hours daily on MIS preparation. This includes collecting data from salesmen, entering it into Excel, cross-checking with invoices and payment records, and formatting reports for management review. Monthly consolidation can take an additional 2-3 full days.
Yes. Modern DMS platforms like SpireStock offer API-based integration with Tally, Busy, SAP Business One, and other popular accounting systems used by Indian distributors. This means financial data (invoices, payments, credit notes) flows bi-directionally, ensuring MIS reports reflect accurate financial positions without duplicate data entry.
Primary sales refers to company-to-distributor sales (what the distributor purchases from the brand). Secondary sales refers to distributor-to-retailer sales (what moves through to the market). Effective MIS tracks both because the gap between primary and secondary sales indicates channel stuffing, slow-moving stock, or demand misalignment. Secondary sales tracking is the more critical metric for market performance.
Automated MIS generates GST-ready reports including GSTR-1 data (outward supplies), HSN-wise summary, tax liability reports, and input tax credit tracking. These reports are generated automatically from invoice data, eliminating the manual compilation that causes errors and delays during GST filing. This saves 2-3 days of effort per month during tax filing periods.
A comprehensive DSR should include: date-wise total sales (value and volume), salesman-wise breakup, product-wise/category-wise split, beat-wise or territory-wise summary, number of productive calls vs total calls, average bill value, new outlet additions, returns received, payments collected, and comparison against daily targets. The DSR should be available by end-of-day or early next morning for actionable insights.
Related SpireStock Features
Powerful dashboards with sales trends, MIS reports, and distribution analytics.
Real-time GPS tracking of vehicles and drivers with route optimization for faster deliveries.
GST-compliant invoicing with HSN codes, gate passes, and financial ledger.
Related Industries
Streamline FMCG distribution with order management, beat planning, retailer tracking, and GST billing. Built for Indian FMCG supply chains.
End-to-end dairy distribution software for milk, curd, paneer, and ghee brands. Manage orders, crates, cold chain, and GST billing in one platform.
Related Solutions
Manage your entire distributor network digitally. Onboarding, credit limits, outstanding tracking, and performance analytics. Start free trial.
Boost field sales team productivity with beat planning, GPS attendance, order capture, and performance analytics. Built for Indian FMCG teams.
Related Entities
Ready to Streamline Your Distribution?
Start your free 30-day trial and see how SpireStock can transform your dairy, FMCG or consumer-goods distribution operation, from order capture to crate recovery.
SpireStock Team
Distribution Technology Experts
SpireStock Team writes for SpireStock on distribution management, supply-chain optimisation and field operations for Indian dairy and FMCG brands.


