अधिकांश भारतीय FMCG वितरक क्यों कम प्रदर्शन करते हैं
भारतीय FMCG वितरण उद्योग ₹5.5 लाख करोड़ से अधिक का है, फिर भी औसत वितरक अपने क्षेत्र में केवल 60-70% बिक्री क्षमता कैप्चर करता है। शीर्ष-प्रदर्शन और औसत वितरकों के बीच मासिक राजस्व में 40-50% का अंतर हो सकता है। अंतर भूगोल या भाग्य नहीं है — यह सही तरीकों और तकनीक से संचालित निष्पादन अनुशासन है।
चाहे आप मुंबई, दिल्ली, या इंदौर और कोयंबटूर जैसे टियर-2 शहरों में काम करते हों, डिस्ट्रीब्यूटर बिक्री बढ़ाने के सिद्धांत समान रहते हैं।
12-तरीका ढांचा: अवलोकन
| तरीका | अपेक्षित बिक्री सुधार | कार्यान्वयन समयसीमा | निवेश स्तर |
|---|---|---|---|
| बीट प्लानिंग ऑप्टिमाइज़ेशन | 15-22% | 2-4 सप्ताह | कम |
| स्कीम अनुपालन प्रवर्तन | 12-18% | 1-2 सप्ताह | कम |
| सेकेंडरी सेल्स दृश्यता | 18-25% | 4-6 सप्ताह | मध्यम |
| रिटेलर कवरेज विस्तार | 20-30% | 4-8 सप्ताह | मध्यम |
| SKU तर्कसंगतीकरण | 8-15% | 2-4 सप्ताह | कम |
| सेल्समैन उत्पादकता वृद्धि | 15-20% | 2-6 सप्ताह | कम-मध्यम |
| डेटा-संचालित क्षेत्र प्रबंधन | 10-18% | 4-8 सप्ताह | मध्यम |
| ऑर्डर पूर्ति दर सुधार | 12-20% | 2-4 सप्ताह | मध्यम |
| ट्रेड प्रमोशन ऑप्टिमाइज़ेशन | 10-15% | 2-4 सप्ताह | कम |
| डिजिटल भुगतान एकीकरण | 8-12% | 1-2 सप्ताह | कम |
| क्रॉस-सेलिंग और अपसेलिंग प्रोग्राम | 10-18% | 4-6 सप्ताह | कम |
| रियल-टाइम परफॉर्मेंस डैशबोर्ड | 12-20% | 1-2 सप्ताह | मध्यम |
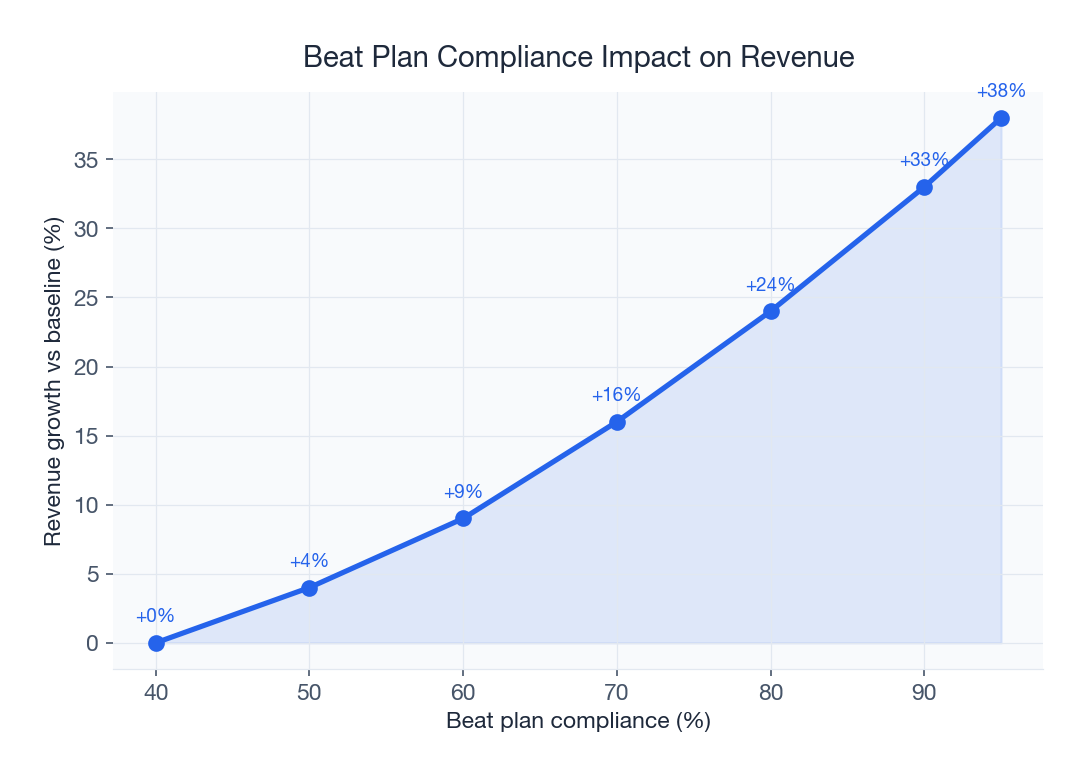
तरीका 1: बीट प्लानिंग ऑप्टिमाइज़ेशन
बीट प्लानिंग डिस्ट्रीब्यूटर बिक्री सुधार के लिए सबसे प्रभावशाली लीवर है। एक अच्छी तरह से डिज़ाइन किया गया बीट सुनिश्चित करता है कि हर सेल्समैन सही आउटलेट, सही आवृत्ति पर, सबसे कुशल अनुक्रम में विज़िट करे। फिर भी 500+ भारतीय FMCG वितरकों के हमारे विश्लेषण से पता चलता है कि 70% पुरानी या खराब तरीके से डिज़ाइन की गई बीट योजनाओं का उपयोग करते हैं।
मिनी केस स्टडी: Parle प्रोडक्ट्स डिस्ट्रीब्यूटर, पुणे
पुणे में एक Parle वितरक ने पिछले 6 महीनों की बिक्री के डेटा का उपयोग करके अपनी बीट पुनर्संरचित की। उन्होंने पाया कि उनके सेल्समैन समय का 30% उन आउटलेट पर खर्च होता था जो केवल 8% राजस्व में योगदान करते थे। विज़िट पुनर्वितरण करके, उन्होंने बिना अतिरिक्त सेल्समैन के 8 सप्ताह में 21% राजस्व वृद्धि हासिल की।
तरीका 2: स्कीम अनुपालन प्रवर्तन
भारतीय FMCG कंपनियां ट्रेड स्कीम पर सालाना हजारों करोड़ खर्च करती हैं, फिर भी वितरक स्तर पर औसत स्कीम अनुपालन 55-65% के आसपास है। एक मजबूत स्कीम मैनेजमेंट इंजन सुनिश्चित करता है कि हर स्कीम इच्छित रिटेलर तक सही रूप में पहुंचे।
तरीका 3: सेकेंडरी सेल्स दृश्यता
प्राइमरी सेल्स (कंपनी से वितरक) आपको बताती है कि क्या भेजा गया। सेकेंडरी सेल्स (वितरक से रिटेलर) बताती है कि वास्तव में क्या बिका। सेकेंडरी सेल्स दृश्यता के बिना, ब्रांड और वितरक अंधे हैं।
तरीका 4: रिटेलर कवरेज विस्तार
भारत में अधिकांश FMCG वितरक अपने क्षेत्र में केवल 60-75% संबोधनीय आउटलेट कवर करते हैं। शेष 25-40% एक विशाल अनुपयुक्त राजस्व अवसर है।
कवरेज विस्तार ढांचा
| बाज़ार प्रकार | सामान्य कवरेज | लक्ष्य कवरेज | प्रति 10% लाभ राजस्व अवसर |
|---|---|---|---|
| मेट्रो (मुंबई, दिल्ली, बेंगलुरु) | 70-80% | 90-95% | ₹3-5 लाख/माह |
| टियर-1 (पुणे, जयपुर, लखनऊ) | 60-70% | 85-90% | ₹2-3.5 लाख/माह |
| टियर-2 (नागपुर, कोयंबटूर, इंदौर) | 50-65% | 80-85% | ₹1.5-2.5 लाख/माह |
| ग्रामीण/अर्ध-शहरी | 35-50% | 65-75% | ₹1-2 लाख/माह |
तरीका 5: SKU तर्कसंगतीकरण
भारत में औसत FMCG वितरक 150-300 SKU रखता है। लेकिन विश्लेषण लगातार दिखाता है कि 20-25% SKU कुल राजस्व का 3% से कम योगदान करते हैं। SKU तर्कसंगतीकरण आपकी सेल्सफोर्स को सबसे महत्वपूर्ण उत्पादों पर केंद्रित करने के बारे में है।
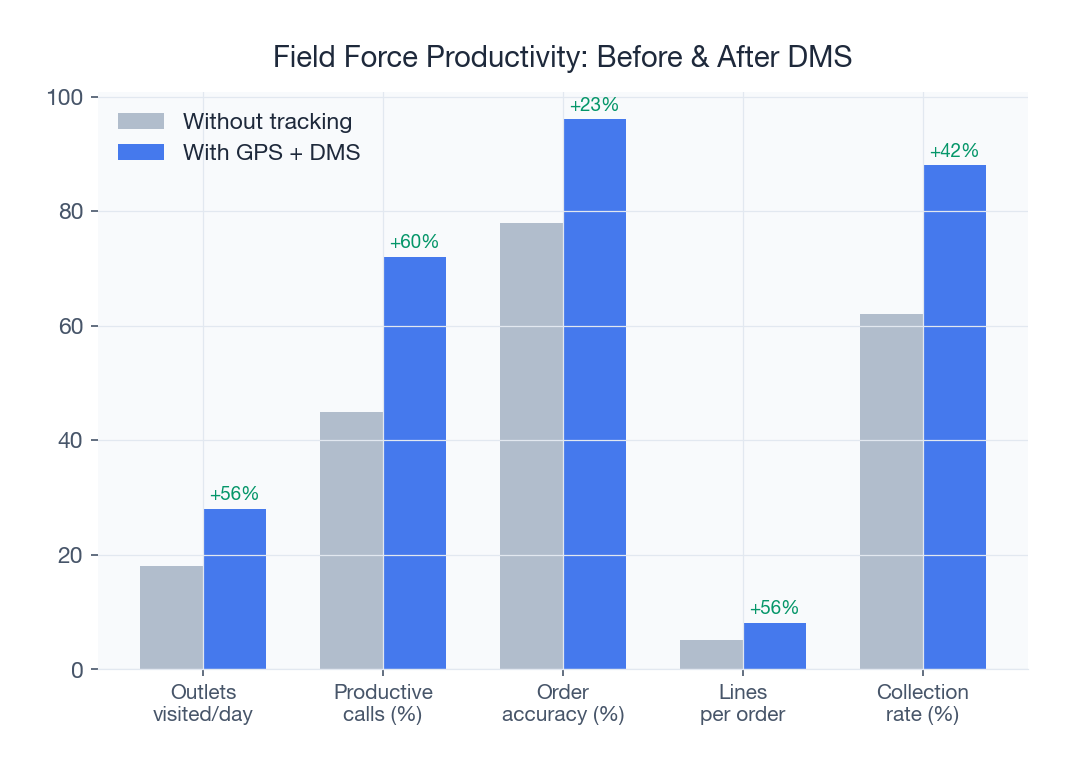
तरीका 6: सेल्समैन उत्पादकता वृद्धि
भारत में औसत FMCG सेल्समैन प्रतिदिन 25-30 रिटेल कॉल करता है लेकिन केवल 60-70% कॉल में उत्पादक ऑर्डर प्राप्त करता है। उपस्थिति और गतिविधि ट्रैकिंग सेल्समैन उत्पादकता सुधार की नींव प्रदान करती है।
तरीका 7: डेटा-संचालित क्षेत्र प्रबंधन
भारतीय FMCG में क्षेत्र प्रबंधन पारंपरिक रूप से पिन कोड या नगरपालिका सीमाओं पर आधारित था। 2026 में, अग्रणी वितरक डेटा-संचालित क्षेत्र प्रबंधन का उपयोग करते हैं।
मुख्य अंतर्दृष्टि: डेटा से पता चलता है कि जो वितरक प्रदर्शन डेटा के आधार पर त्रैमासिक रूप से क्षेत्र पुनर्संरेखित करते हैं, वे स्थैतिक क्षेत्र बनाए रखने वालों की तुलना में 10-18% अधिक वृद्धि हासिल करते हैं।
तरीका 8: ऑर्डर पूर्ति दर सुधार
हर अपूर्ण ऑर्डर एक खोई हुई बिक्री है जो अक्सर प्रतिस्पर्धी के पास जाती है। भारतीय FMCG वितरकों में औसत ऑर्डर पूर्ति दर 82-88% है।
मिनी केस स्टडी: ITC डिस्ट्रीब्यूटर, बेंगलुरु
बेंगलुरु में एक ITC वितरक शीर्ष-बिकने वाले बिस्किट और नूडल वेरिएंट पर बार-बार स्टॉकआउट के कारण 84% पूर्ति दर से जूझ रहा था। उन्होंने A-श्रेणी SKU के लिए सेफ्टी स्टॉक 3 दिन से बढ़ाकर 6 दिन किया। 6 सप्ताह में, उनकी पूर्ति दर 96% तक चढ़ गई और मासिक बिक्री ₹6.8 लाख बढ़ी।
तरीका 9-12: ट्रेड प्रमोशन, डिजिटल भुगतान, क्रॉस-सेलिंग, डैशबोर्ड
रियल-टाइम परफॉर्मेंस डैशबोर्ड मेट्रिक्स
| मेट्रिक | बेंचमार्क (औसत) | लक्ष्य (शीर्ष प्रदर्शक) | सुधार का प्रभाव |
|---|---|---|---|
| प्रति दिन उत्पादक कॉल | 18-22 | 28-32 | प्रत्यक्ष राजस्व वृद्धि |
| प्रति बिल लाइनें | 4-6 | 8-12 | प्रति आउटलेट उच्च राजस्व |
| औसत बिल मूल्य | ₹1,800-2,500 | ₹3,500-5,000 | बेहतर ऑर्डर अर्थशास्त्र |
| स्ट्राइक रेट (%) | 60-70% | 82-90% | बेहतर कॉल दक्षता |
| नए आउटलेट जुड़ाव/माह | 5-10 | 20-30 | कवरेज वृद्धि |
| स्कीम उपयोग दर | 55-65% | 85-95% | बेहतर प्रमोशन ROI |
मिनी केस स्टडी: Dabur डिस्ट्रीब्यूटर, लखनऊ
लखनऊ में एक Dabur वितरक ने 90 दिनों में इस चरणबद्ध दृष्टिकोण का पालन किया। ₹22 लाख मासिक राजस्व से शुरू होकर, उन्होंने महीने 3 के अंत तक ₹34 लाख हासिल किए — 55% सुधार। उनके वितरण तकनीक में निवेश पहले 45 दिनों में ही वापस मिल गया।
बिक्री वृद्धि के लिए तकनीकी नींव
SpireStock का डिस्ट्रीब्यूशन मैनेजमेंट प्लेटफॉर्म भारतीय FMCG वितरकों के लिए उद्देश्य-निर्मित है। प्लेटफॉर्म पर वितरक पहले 6 महीनों में औसतन 35-45% बिक्री सुधार रिपोर्ट करते हैं।
अपनी वितरण बिक्री प्रदर्शन बदलने के लिए तैयार हैं? हमारे वितरण विशेषज्ञों से बात करें या हमारी लचीली प्राइसिंग योजनाएं देखें।
स्रोत एवं संदर्भ
अक्सर पूछे जाने वाले प्रश्न
बीट प्लानिंग ऑप्टिमाइज़ेशन सबसे तेज़ परिणाम देता है। आउटलेट मूल्य और भौगोलिक क्लस्टरिंग के आधार पर सेल्समैन रूट पुनर्संरचित करके, वितरक अतिरिक्त स्टाफ के बिना 2-4 सप्ताह में 15-22% बिक्री सुधार देखते हैं।
उद्योग औसत 55-65% से 85-90% तक स्कीम अनुपालन सुधारना आमतौर पर 12-18% अतिरिक्त बिक्री देता है। बिलिंग पर स्वचालित रूप से प्रमोशन लागू करने वाले डिजिटल स्कीम इंजन मैनुअल त्रुटियों को समाप्त करते हैं।
सेकेंडरी सेल्स दृश्यता ऑर्डरिंग गैप पहचानने, मांग सटीक पूर्वानुमान करने और सेल्समैन को जवाबदेह रखने में मदद करती है। दैनिक सेकेंडरी सेल्स कैप्चर लागू करने वाले वितरक पहली तिमाही में 18-25% बिक्री सुधार रिपोर्ट करते हैं।
मेट्रो वितरकों को 90-95% आउटलेट कवरेज, टियर-1 शहरों में 85-90%, टियर-2 शहरों में 80-85%, और ग्रामीण क्षेत्रों में 65-75% लक्षित करना चाहिए। कवरेज में हर 10% सुधार से बाज़ार आकार के आधार पर मासिक ₹1.5-5 लाख जुड़ता है।
SKU तर्कसंगतीकरण में कम-प्रदर्शन वाले उत्पादों पर ध्यान कम करते हुए उच्च-प्रदर्शन वाले उत्पादों पर बिक्री प्रयास केंद्रित करना शामिल है। ABC वर्गीकरण और मस्ट-सेल लिस्ट का उपयोग करके, वितरक आमतौर पर प्रति-बिल मूल्य में 8-15% सुधार और बेहतर गोदाम टर्नओवर देखते हैं।
आधुनिक डिस्ट्रीब्यूशन मैनेजमेंट सॉफ्टवेयर की लागत टीम आकार और मॉड्यूल के आधार पर ₹5,000-25,000 प्रति माह है। अधिकांश वितरक बेहतर बिक्री दक्षता, बेहतर स्कीम अनुपालन और कम स्टॉकआउट के माध्यम से 30-45 दिनों में यह निवेश वसूल करते हैं।
बीट ऑप्टिमाइज़ेशन और स्कीम अनुपालन जैसे त्वरित लाभ 2-4 सप्ताह में परिणाम दिखाते हैं। सभी प्रमुख तरीकों को कवर करने वाला व्यापक 90-दिवसीय कार्यान्वयन आमतौर पर भारत में FMCG वितरकों के लिए 30-60% संयुक्त बिक्री सुधार देता है।
शीर्ष-प्रदर्शन FMCG सेल्समैन 82% से अधिक स्ट्राइक रेट के साथ प्रति दिन 28-32 उत्पादक कॉल करते हैं। उद्योग औसत 60-70% स्ट्राइक रेट पर 18-22 उत्पादक कॉल है। मोबाइल सेल्स ऐप और रूट ऑप्टिमाइज़ेशन इस अंतर को पाटने में मदद करते हैं।
संबंधित SpireStock विशेषताएँ
सेल्स ट्रेंड्स, MIS रिपोर्ट्स और डिस्ट्रिब्यूशन एनालिटिक्स के साथ शक्तिशाली डैशबोर्ड।
लचीली इंसेंटिव स्कीमें — फ्लैट, बल्क-पैक और क्वांटिटेटिव — स्वचालित रूप से लागू।
स्थान सत्यापन और यात्रा विश्लेषण के साथ जियो-टैग की गई उपस्थिति।
संबंधित समाधान
बीट प्लानिंग, GPS उपस्थिति, ऑर्डर कैप्चर और प्रदर्शन विश्लेषण के साथ फील्ड सेल्स टीम उत्पादकता बढ़ाएँ। भारतीय FMCG टीमों के लिए बनाया गया।
अपने रिटेल नेटवर्क को ट्रैक और प्रबंधित करें। आउटलेट्स जियो-टैग करें, सेकंडरी सेल्स कैप्चर करें, बीट्स प्रबंधित करें और रिटेलर प्रदर्शन पर नज़र रखें। SpireStock आज़माएँ।
संबंधित संस्थाएँ
अपने वितरण को सुव्यवस्थित करने के लिए तैयार हैं?
अपना 30 दिन का निःशुल्क परीक्षण शुरू करें और देखें कि SpireStock कैसे आपके डेयरी, FMCG या उपभोक्ता वस्तु वितरण को ऑर्डर से क्रेट वापसी तक बदल सकता है।
SpireStock Team
डिस्ट्रिब्यूशन टेक्नोलॉजी विशेषज्ञ
SpireStock Team SpireStock के लिए डिस्ट्रिब्यूशन प्रबंधन, सप्लाई-चेन ऑप्टिमाइज़ेशन और भारतीय डेयरी व FMCG ब्रांड्स के लिए फील्ड ऑपरेशंस पर लिखती है।


