Why Beat Planning Matters
In Indian FMCG, the difference between a Rs 100 crore brand and a Rs 1,000 crore brand often comes down to one thing: how efficiently their field force covers retail outlets. A well-planned beat, the daily route a salesman follows, can generate 40-60% more sales than a poorly planned one. Multiply that across hundreds of salespeople and thousands of outlets, and beat planning becomes a multi-crore productivity lever that most brands underestimate.
Yet most Indian FMCG brands still plan beats manually. Area Sales Managers draw routes on paper maps, assign retailers based on tribal knowledge, and hope for the best. The result is uneven coverage, duplicate visits, missed outlets, and salesmen wasting 30-40% of their day on travel instead of selling. Beat planning software fixes all of this. If you want to see it in action, book a free demo with our team.
India's FMCG market is projected to reach USD 220 billion by 2027 (IBEF, 2025), with over 12 million kirana stores forming the backbone of distribution. According to NielsenIQ, brands with digitized beat plans achieve 28-35% higher secondary sales per outlet compared to those relying on manual methods. With margins under constant pressure and competition intensifying in every category from dairy to beverages, the efficiency of your field force is not a nice-to-have. It is the single biggest determinant of whether your distribution economics work.
What is Beat Planning Software?
Beat planning software is a specialized platform that automates the design, execution, and monitoring of field sales beats. It considers retailer density, geography, order frequency, sales potential, and salesman capacity to generate optimal routes that maximize outlet coverage and revenue per day. Combined with GPS-based beat tracking, it ensures salesmen actually follow their assigned beats, not just pretend to.
For a primer on beat planning itself, read our companion article What is Beat Planning in FMCG?. If you are evaluating distribution management software for your business, understanding beat planning is a critical first step.
Challenges with Manual Beat Planning
1. Uneven Retailer Distribution
One salesman gets 200 outlets crowded in 3 km; another gets 80 outlets spread over 25 km. Both work the same hours but generate wildly different results. Manual planning rarely balances workload effectively. In cities like Mumbai and Delhi, where outlet density can vary 10x between adjacent neighborhoods, this problem is acute.
2. Missed Outlets
Without digital tracking, some outlets get visited every week while others are forgotten for months. Missed outlets mean missed sales, and loyal retailers feel ignored. According to BCG's India consumer research, a missed visit to a high-frequency outlet costs the brand an average of Rs 800-1,200 in lost daily sales.
3. Duplicate Visits
Multiple salesmen, perhaps from different product categories, end up visiting the same retailer on the same day, wasting time and annoying the retailer.
4. No Visibility for Managers
Area Sales Managers have no real-time visibility into whether salesmen are following their beats. They rely on self-reported tracking from paper logs, which is unreliable. This is why GPS-based attendance tracking has become essential.
5. Slow Adaptation
When new retailers open or old ones close, beats should be adjusted. Manual beat updates are slow, and routes drift from reality over time. In fast-growing markets like Bangalore and Hyderabad, where hundreds of new retail outlets open every month, static beat plans become obsolete within weeks.
The Science of Territory Design
Before beat planning begins, territories must be designed. Territory design is the strategic division of a geographic market into manageable units that can be assigned to individual salesmen or teams. It sits one level above beat planning: territories define who owns which market; beats define how they cover it day by day.
Effective territory design balances three competing objectives:
- Workload equity - each salesman should have a comparable number of outlets, adjusted for outlet size and order complexity
- Geographic compactness - territories should be contiguous and minimize dead travel time between outlets
- Revenue potential - territories should have roughly equal revenue potential so that salesmen have equal earning opportunities
Operations research has formalized this as the Territory Design Problem (TDP), a variant of the multi-objective partitioning problem. The mathematical goal is to partition a set of outlets into k territories that minimize variance in workload, travel distance, and revenue across all territories simultaneously. While exact solutions are computationally expensive (NP-hard), heuristic algorithms produce near-optimal results in seconds.
How Leading FMCG Companies Approach Territory Design in India
HUL (Hindustan Unilever), India's largest FMCG company, divides the country into approximately 2,000 redistribution stockist (RS) territories. Each RS territory is further divided into salesman territories based on a target of 250-350 outlets per salesman per week. HUL's territory design considers population density, retail census data, and brand penetration targets. Their system ensures that every outlet in India, from a corner paan shop in Kolkata to a supermarket in Pune, falls within exactly one salesman's territory.
ITC's distribution approach segments territories differently. ITC uses a hub-and-spoke model where urban territories are smaller (150-200 outlets) but denser, while rural territories are larger geographically but contain fewer outlets. Their annual report highlights that territory rationalization contributed to a 12% improvement in distribution cost-to-revenue ratio between 2022 and 2025.
Modern distributor management platforms automate territory design by ingesting retailer master data, geocoding every outlet, and running optimization algorithms that produce balanced territory maps in minutes rather than the weeks it takes manually.
Beat Planning Algorithms: Manual vs Rule-Based vs AI
Not all beat planning software is created equal. The sophistication of the underlying algorithm determines how optimal your beats actually are. There are three generations of beat planning technology, each representing a significant leap in capability.
Manual Beat Planning (Paper and Excel)
The oldest and still most common method in Indian FMCG. An Area Sales Manager uses a printed map, a list of retailers, and personal knowledge to draw beat routes. Beats are documented in Excel or on paper, photocopied, and distributed to salesmen. Changes require manual effort and typically happen only once a quarter.
Advantages: No technology investment needed. Uses local knowledge. Simple to understand.
Disadvantages: Error-prone. Ignores traffic patterns. Cannot optimize across hundreds of variables. Slow to adapt. No enforcement mechanism. Depends on the ASM's personal knowledge, which is lost when they transfer.
Rule-Based Beat Planning (DMS Software)
The current generation of distribution management software uses systematic, rule-based algorithms. The software applies predefined rules: visit frequency based on outlet category, geographic clustering for proximity, workload caps per salesman, and day-of-week constraints. This produces consistent, repeatable beat plans that are far superior to manual methods.
Advantages: Consistent. Scalable. Considers multiple constraints simultaneously. Easy to rebalance when outlets change. Provides enforcement through mobile apps and GPS tracking.
Disadvantages: Rules are static. Does not learn from outcomes. Cannot predict which outlets need more or fewer visits based on buying behavior. Treats all outlets in a category equally.
AI-Powered Beat Planning (Predictive and Self-Optimizing)
The emerging generation uses machine learning to continuously optimize beats based on outcomes. AI-powered systems analyze historical order data, seasonal patterns, retailer buying cycles, and even external signals (weather, festivals, competitor promotions) to predict the optimal visit time and frequency for each individual outlet.
Advantages: Self-improving. Predicts optimal visit windows. Personalizes visit frequency per outlet. Adapts to seasonal changes automatically. Can recommend what products to pitch at each outlet.
Disadvantages: Requires 6-12 months of historical data. Higher cost. More complex implementation. May be overkill for small distributors.
Comparison: Three Approaches to Beat Planning
| Dimension | Manual (Paper/Excel) | Rule-Based (DMS) | AI-Powered |
|---|---|---|---|
| Setup time | 2-4 weeks | 2-5 days | 1-2 weeks + training period |
| Outlets per day achieved | 45-65 | 75-100 | 85-110 |
| Adaptability | Quarterly manual review | On-demand rebalancing | Continuous self-optimization |
| Data dependency | None | Retailer master only | 6-12 months order history |
| Visit frequency personalization | Category-level only | Category + geography | Individual outlet level |
| Predictive capability | None | None | Order prediction, churn alerts |
| Cost per user/month | Rs 0 (labor cost hidden) | Rs 300-1,500 | Rs 1,500-3,000 |
| Best for | Very small distributors (<5 salesmen) | Mid-size distributors (5-200 salesmen) | Large enterprises (200+ salesmen) |
Most Indian FMCG distributors today are moving from manual to rule-based systems. The jump from manual to rule-based delivers 80% of the total possible improvement. AI adds the remaining 20%, but at higher cost and complexity. For most businesses, starting with a solid rule-based route optimization platform is the right first step.
Core Features of Beat Planning Software
1. Retailer Master Database
Every retailer in your territory is mapped to an address, GPS coordinate, category, and historical sales. This master database is the foundation of beat planning. Retailer tracking ensures this data stays current as outlets open, close, or change ownership.
2. Automatic Beat Generation
The software divides retailers into beats based on geography, density, and workload balance. Each beat has a defined visit frequency (daily, weekly, bi-weekly) and an assigned salesman.
3. Route Optimization Within Beats
For each beat, the system generates an optimal visit sequence that minimizes travel time. Route optimization considers traffic patterns and outlet operating hours.
4. Mobile App for Salesmen
The mobile app shows today's beat, next outlet, product catalog, schemes, and order placement. GPS check-in at each outlet verifies beat adherence.
5. Beat Adherence Tracking
GPS traces confirm the salesman visited each outlet in the correct sequence. Attendance and movement tracking eliminates fake visits and provides audit-ready records.
6. Productivity Analytics
Sales analytics show beat productivity, outlets visited, conversion rate, average order value, and total revenue per beat. Managers can identify high and low performers.
7. Dynamic Beat Rebalancing
As retailers open, close, or change, the system automatically suggests beat adjustments. No more quarterly manual rework.
8. Integration with DMS
Beat data integrates with the main distribution tracking platform, linking field visits to orders, invoices, and secondary sales.
Retailer Segmentation and Visit Frequency
One of the most powerful capabilities of beat planning software is the ability to classify retailers into tiers and set differentiated visit frequencies. Not every outlet deserves the same attention. A high-volume retailer generating Rs 50,000 in monthly orders should be visited far more often than a small outlet doing Rs 2,000.
The Diamond-Gold-Silver-Bronze Framework
Most Indian FMCG companies use a four-tier classification system based on monthly purchase value, growth potential, and strategic importance:
| Tier | Monthly Purchase Value | Share of Outlets | Share of Revenue | Recommended Visit Frequency |
|---|---|---|---|---|
| Diamond | Rs 25,000+ | 5-8% | 35-45% | Daily or every alternate day |
| Gold | Rs 10,000-25,000 | 15-20% | 30-35% | 3 times per week |
| Silver | Rs 3,000-10,000 | 30-35% | 15-20% | Weekly |
| Bronze | Below Rs 3,000 | 35-45% | 5-10% | Bi-weekly or monthly |

This framework follows the classic Pareto principle: roughly 25% of outlets (Diamond + Gold) generate 65-80% of revenue. Beat planning software automatically classifies retailers based on rolling sales data from order management and adjusts visit frequencies accordingly.
Dynamic Reclassification
Retailer tiers should not be static. A Silver outlet that starts ordering more aggressively should be promoted to Gold and visited more frequently. Conversely, a Gold outlet that declines should be reassigned to Silver to free up salesman time for growing outlets. Software-driven beat planning makes this reclassification automatic, triggered by order data, rather than waiting for a quarterly review that never happens.
HUL reportedly reclassifies its outlet universe quarterly, but leading digital-first brands are moving to monthly or even real-time reclassification. The impact is significant: McKinsey's India retail research found that brands practicing dynamic retailer segmentation achieve 18-22% higher revenue per salesman than those using static classifications.
Secondary Sales Capture Through Beats
One of the most valuable byproducts of disciplined beat execution is accurate secondary sales data. In Indian FMCG, secondary sales (sales from distributor to retailer) are the true measure of demand, yet they remain one of the hardest metrics to capture reliably.
Why Secondary Sales Data Matters
Primary sales (company to distributor) tell you how much product you pushed into the channel. Secondary sales tell you how much product actually moved to retailers, which is a much better indicator of real consumer demand. Brands that rely only on primary sales data for planning end up with two problems: channel stuffing (distributors sitting on excess inventory) and demand forecasting errors.
When every field visit generates a digital order through the mobile app, you get outlet-level secondary sales data in real time. This data feeds directly into:
- Demand planning - accurate SKU-level demand signals from the field, not estimates
- Scheme calculation - verify that trade schemes are reaching the right outlets and generating incremental sales
- Retailer performance tracking - identify which outlets are growing, declining, or churning
- Territory health assessment - spot underperforming territories before they become problems
NielsenIQ estimates that Indian FMCG brands with real-time secondary sales visibility achieve 15-20% better forecast accuracy than those relying on monthly manual reports. Explore how our sales analytics and retailer tracking modules make this possible.
Beat-Linked Order Capture
The key is linking every order to a specific beat, salesman, outlet, and timestamp. When a salesman visits an outlet on his assigned beat and places an order through the app, the system captures not just the order details but the complete context: which beat, what time, how long the visit lasted, what was the sequence position, and whether the visit was planned or ad-hoc. This contextual data is gold for distribution analytics.
Beat Planning KPIs: Before vs After Software
| KPI | Manual Planning | With Software | Improvement |
|---|---|---|---|
| Outlets per day | 45-65 | 75-100 | 50% higher |
| Beat adherence | 70-85% | 95-98% | 15 pts higher |
| Travel time share | 35-45% | 20-28% | 40% lower |
| Missed outlets | 15-25% | < 3% | Near-zero |
| Avg order value | Baseline | +15-25% | Higher |
| Time to reassign beats | 2-4 weeks | 1-2 days | 90% faster |

Categories That Benefit Most
- FMCG distribution - packaged foods, personal care, home care
- Beverages - water, soft drinks, juices
- Bakery and confectionery - bread, biscuits, cakes
- Dairy distribution - milk, curd, butter, ice cream
Beat Planning Software Pricing
Beat planning modules are usually part of broader distribution management platforms. Expect Rs 300-800 per user per month for basic beat planning, Rs 800-1,500 for advanced features with GPS and analytics. As a standalone module, pricing starts around Rs 5,000/month for small teams. See our pricing page for details.
Real-World Case Studies
Case Study 1: Regional FMCG Distributor in Chennai
A regional FMCG distributor in Chennai with 45 salesmen covering 8,500 outlets across Tamil Nadu struggled with uneven coverage, 22% missed outlets, and only 58 average outlets-per-day productivity. After implementing SpireStock's beat planning module:
- Outlets-per-day jumped from 58 to 89
- Missed outlets dropped from 22% to 2.5%
- Monthly revenue increased by 23%
- Salesman attrition dropped as their earnings grew
- Beat rebalancing time dropped from weeks to minutes
Case Study 2: Dairy Brand in Gujarat
A mid-size dairy brand in Ahmedabad, Gujarat, operating across 12,000 retail outlets with 65 salesmen faced a unique challenge: their product portfolio included perishable items (fresh milk, curd, buttermilk) that required daily delivery alongside shelf-stable products (ghee, paneer, flavored milk) that needed weekly visits. Manual beat planning could not handle this dual-frequency requirement effectively.
The brand was losing 3-4% of perishable products to expiry because delivery routes were inefficient, and salesmen were spending too much time on low-priority shelf-stable deliveries at the expense of time-sensitive fresh products. After deploying SpireStock's beat planning with dual-frequency optimization:
- Perishable product wastage dropped from 3.8% to 0.9%, saving Rs 12 lakh monthly
- Fresh product delivery was completed before 10 AM for 92% of outlets (up from 61%)
- Shelf-stable product coverage improved from 72% to 96% weekly compliance
- Overall revenue per salesman increased by 31%
- Retailer complaints about late deliveries dropped by 78%
The key insight was that beat planning software could assign different visit frequencies to the same outlet based on product category, something impossible to manage consistently with paper-based planning.
Case Study 3: FMCG Distributor in Hyderabad
A large FMCG distributor in Hyderabad managing 80 salesmen across Telangana and Andhra Pradesh faced a scaling crisis. The business had grown from 30 to 80 salesmen in 18 months, but their manual beat planning process could not keep up. New salesmen were assigned beats based on gut feel, leading to massive overlap in high-density areas of Hyderabad while rural outlets in Andhra Pradesh were severely underserved.
The distributor was also running 15-20 trade schemes at any time through the scheme engine, but had no way to verify whether salesmen were communicating schemes to the right outlets. Scheme leakage, a problem we discuss in detail in our scheme leakage prevention guide, was estimated at 8-12% of scheme spend.
After implementing digital beat planning with SpireStock:
- Territory overlap was eliminated through algorithmic territory design, reducing duplicate visits by 94%
- Rural outlet coverage in Andhra Pradesh improved from 55% to 91%
- Scheme communication compliance reached 88% (measured through in-app scheme acknowledgment at each outlet)
- New salesman onboarding time dropped from 3 weeks to 4 days, the app guided them through their beats
- Monthly revenue grew 27% within 6 months, with the rural expansion contributing 40% of the new revenue
Want similar results? Talk to our team.
Change Management: Getting Field Teams to Adopt
The most common reason beat planning software fails is not technology. It is adoption. Field sales teams in Indian FMCG have worked a certain way for years, sometimes decades. Asking them to change their daily routine triggers resistance, and if that resistance is not managed carefully, even the best software will sit unused.
Common Resistance Points
- "The app doesn't work in my area" - Connectivity issues in tier-3 towns and rural areas are real. The solution is offline-first app design that syncs when connectivity returns. SpireStock's mobile app works fully offline.
- "I know my retailers better than any software" - Experienced salesmen have legitimate local knowledge. The answer is not to dismiss their expertise but to incorporate it: let them suggest beat modifications that the system can evaluate and approve.
- "GPS tracking means the company doesn't trust me" - Frame GPS not as surveillance but as proof of work. When the system shows a salesman visited 95 outlets in a day with GPS proof, it eliminates disputes about incentive calculations. Most salesmen eventually appreciate having documented evidence of their productivity.
- "I can't use this phone/app" - Many field salesmen in tier-2 and tier-3 areas have limited smartphone literacy. The app must be simple enough to use with minimal training.
Incentive Alignment Strategies
The fastest way to drive adoption is to align incentives with the new system:
- Beat adherence bonus - Pay a small daily bonus (Rs 50-100) for achieving 90%+ beat compliance. This makes the app financially attractive from day one.
- Productivity-linked pay - Tie a portion of variable pay to outlets-per-day and productive call percentage, metrics that improve naturally when beats are followed.
- Leaderboards - Display daily/weekly rankings within teams. Competitive salesmen will push themselves to rank higher.
- Reduced paperwork - Eliminate manual daily reports. When everything is captured in the app, salesmen save 30-45 minutes of report writing daily. This is a tangible benefit they feel immediately.
Training for Tier-2 and Tier-3 Field Staff
Training approaches that work for metro-based sales teams often fail with field staff in smaller cities. Effective training for tier-2/tier-3 teams requires:
- Vernacular app support - The app should be available in Hindi, Tamil, Telugu, Gujarati, Marathi, Kannada, and Bengali at minimum. SpireStock supports 10+ Indian languages.
- Video-based training - Short 2-3 minute videos in local languages demonstrating each app function, distributed via WhatsApp groups that field teams already use daily.
- Buddy system - Pair each new user with a tech-savvy colleague for the first two weeks. Peer learning is more effective than formal classroom training for field staff.
- Gradual rollout - Start with just check-in/check-out for the first week. Add order capture in week two. Add scheme tracking in week three. Overwhelming users with all features on day one guarantees failure.
Measuring Adoption Success
Track these metrics weekly during the first 90 days of rollout:
- Daily Active Users (DAU) as a percentage of total field staff (target: 90%+ by week 4)
- Average check-ins per user per day (target: matching outlet visit targets by week 6)
- Order capture rate through app vs. manual (target: 95%+ digital by week 8)
- Beat adherence percentage (target: 85%+ by week 4, 95%+ by week 12)
Read more about managing field teams effectively in our field force tracking guide and explore our sales productivity solutions.
Global FMCG Beat Planning Best Practices
Indian FMCG distribution is unique in many ways, but there is much to learn from how global multinationals approach beat planning in other markets and what they have adapted specifically for India.
Unilever's Global Model
Unilever operates in 190+ countries and has arguably the most sophisticated beat planning system in the world. Their global framework, called the "Perfect Store" program, defines visit frequency based on store potential rather than just current sales. In developed markets (Europe, North America), Unilever uses third-party retail audit data to classify stores. In emerging markets (India, Indonesia, Brazil), they rely heavily on their own field force data.
In India, HUL's beat planning covers approximately 8 million direct-reach outlets through a network of 3,500+ redistribution stockists. Their "Shikhar" app equips every salesman with a digital beat plan, real-time inventory visibility, and scheme communication tools. HUL's annual report cites direct reach expansion as a key driver of their consistent market share gains.
P&G's Data-Driven Approach
Procter and Gamble pioneered data-driven territory management through their "Market 2" model. P&G assigns territories based on a composite score that weights outlet count (40%), revenue potential (35%), and competitive intensity (25%). Their system automatically flags territories where actual sales deviate significantly from potential, triggering managerial review.
In India, P&G has been more selective about direct distribution, focusing on high-value urban outlets and using wholesale channels for smaller towns. Their beat plans in metro cities are optimized for fewer but higher-value visits, a strategy that works for their premium product portfolio.
Nestle's Frequency Optimization
Nestle uses a "Right Visit Frequency" (RVF) model that calculates the optimal visit cadence for each individual outlet based on order history, shelf space, and category dynamics. An outlet that orders Maggi noodles weekly but Nescafe monthly gets different visit priorities for different product categories. This multi-frequency approach maximizes salesman productivity by ensuring visits happen when they are most likely to generate orders.
India's Unique Challenges
While these global best practices provide useful frameworks, India presents challenges that exist nowhere else:
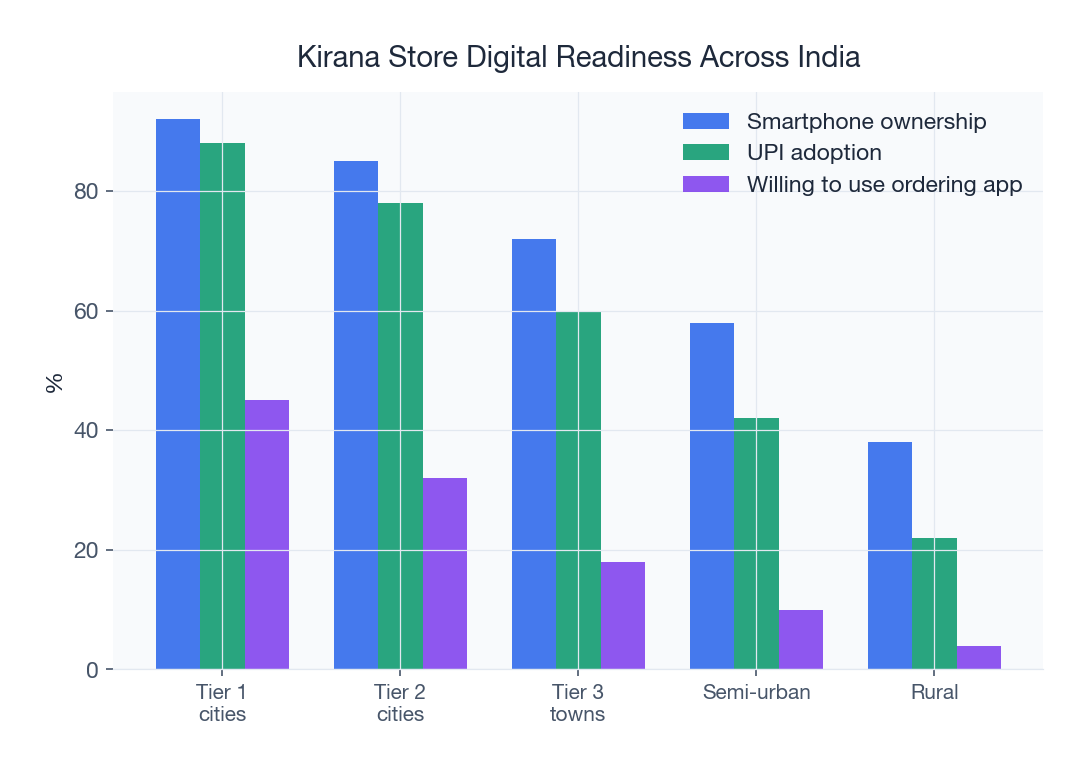
- Extreme retail fragmentation - India has 12-14 million retail outlets, compared to approximately 1 million in the US and 350,000 in the UK. The median Indian kirana store does Rs 5,000-15,000 in daily sales across all categories. This means FMCG brands must cover vastly more outlets with much smaller average order values.
- Poor addressing infrastructure - Many Indian retail outlets do not have formal addresses. In cities like Mumbai and Delhi, addresses might reference landmarks rather than street numbers. GPS coordinates and what3words-style location tags become essential for beat planning accuracy.
- Multi-brand distribution - Unlike Western markets where distributors often handle a single brand family, Indian distributors typically carry 20-50 brands. This means the same outlet may receive visits from the same distributor's salesmen for different brand portfolios, creating coordination complexity.
- Cash-dominant transactions - Despite UPI's rapid growth, 40-50% of kirana transactions are still cash-based (RedSeer Consulting, 2025). Beat planning must account for cash collection cycles and credit management, not just order placement.
- Seasonal and festival demand spikes - Demand can swing 200-400% during festival seasons (Diwali, Eid, Pongal, Navratri). Beat plans must be elastic enough to handle temporary frequency increases without breaking.
Integration with Secondary Sales and Scheme Tracking
Beat planning does not exist in isolation. Its true power emerges when beat data connects with secondary sales capture, scheme tracking, and demand planning to create end-to-end distribution visibility.
The Data Flow: Field Visit to Revenue
Here is how the integration works in a modern distribution management platform:
- Beat execution - Salesman follows his assigned beat, checking in at each outlet via the mobile app
- Order capture - At each outlet, the salesman places an order through the app, which is linked to the order management system
- Scheme application - Applicable trade schemes are automatically applied to the order, ensuring scheme benefits reach the retailer without manual calculation
- Invoice generation - The order generates a GST-compliant invoice through the billing module
- Delivery and fulfillment - The order is dispatched and tracked through distribution tracking
- Secondary sales recording - The completed delivery is recorded as a secondary sale, visible in sales analytics
- Scheme payout verification - At month-end, the system calculates actual scheme payouts based on verified secondary sales data, preventing scheme leakage
This end-to-end integration means that every rupee of trade spend can be traced from the brand's scheme budget through the distributor to the specific retailer who received the benefit. For brands spending 8-15% of revenue on trade schemes, this visibility alone can save 2-4% of scheme budget by eliminating leakage and misallocation.
Demand Planning Benefits
When beat-linked secondary sales data accumulates over 3-6 months, it becomes a powerful demand planning input. You can predict SKU-level demand at the outlet level, identify which outlets are likely to increase orders (and deserve more frequent visits), and spot early signals of competitive displacement before they show up in NielsenIQ retail audit data.
Read more about how modern distribution platforms connect these workflows in our van sales management guide and distributor management solutions.
Implementation Best Practices
- Clean the retailer database first - garbage in, garbage out. Ensure every retailer has correct GPS coordinates, category classification, and contact details. This single step determines 60% of implementation success.
- Start with one region - pilot in a single territory before rolling out nationally. Choose a territory with a cooperative ASM and tech-receptive salesmen. Use the pilot to refine training materials and identify integration issues.
- Involve field teams in design - they know ground realities. A salesman who helped design his own beat will follow it more diligently than one who received a top-down assignment.
- Set clear productivity targets - give salesmen visibility into their own KPIs. When a salesman can see his outlets-per-day trending upward on his phone, he takes ownership of the metric.
- Monitor weekly and refine - beat plans should evolve with market reality. The first version will not be perfect. Plan for weekly reviews during the first month and monthly reviews thereafter.
- Integrate with existing systems - beat planning software should connect with your order management, billing, and distribution tracking modules. Standalone beat planning without integration delivers only 40% of the potential value.
Transform your field force productivity with SpireStock. Our beat planning module has helped brands across Mumbai, Delhi, Bangalore, Chennai, and 15+ Indian cities lift outlets-per-day by 40-60%. Book a demo today.
The Future: AI-Powered Beat Planning
The next generation of beat planning uses AI to predict the best visit time for each retailer based on historical order patterns, recommend personalized pitches based on sales data, and dynamically rebalance beats in response to real-time changes. Brands that adopt AI-powered beat planning in 2026 will have a decisive productivity advantage.
Specific AI capabilities emerging in the market include:
- Predictive order sizing - The system predicts what each retailer is likely to order before the salesman visits, enabling pre-loading of delivery vehicles and reducing out-of-stock situations
- Churn prediction - Machine learning models identify retailers at risk of switching to competitors, triggering proactive retention visits
- Weather and event-adjusted beats - During monsoons in Mumbai or extreme heat in Delhi, AI adjusts beat sequences to account for reduced travel speed and changed buying patterns
- New outlet discovery - GPS trail data from field teams, combined with satellite imagery and business listing data, can identify potential new outlets that are not yet in the retailer master
McKinsey estimates that AI-powered field force optimization can deliver an additional 10-15% productivity improvement over rule-based systems for large FMCG operations with 500+ salesmen.
Conclusion
Beat planning software is one of the highest-ROI investments in FMCG distribution. It directly increases revenue, reduces costs, and improves both retailer and salesman satisfaction. From territory design to retailer segmentation, from secondary sales capture to scheme tracking, a well-implemented beat planning system transforms every aspect of field sales operations.
India's unique retail landscape, with its 12+ million kirana stores, fragmented distribution networks, and diverse geography from Kolkata to Ahmedabad, demands purpose-built solutions that global software cannot provide out of the box. Whether you are a dairy distributor in Gujarat, an FMCG company in Tamil Nadu, or a bakery brand expanding nationally, beat planning software is the foundation on which scalable distribution is built.
If you still plan beats manually, you are leaving significant money on the table, money that modern software can unlock in weeks. Explore our route optimization, sales productivity solutions, and beat planning basics to get started. Ready to see it in action? Request a free demo or check our pricing.
المصادر والمراجع
الأسئلة المتكررة
Beat planning software is a specialized platform that automates field sales beat design, execution, and monitoring. It considers retailer density, geography, sales potential, and salesman capacity to generate optimal routes, then tracks beat adherence via GPS and mobile apps.
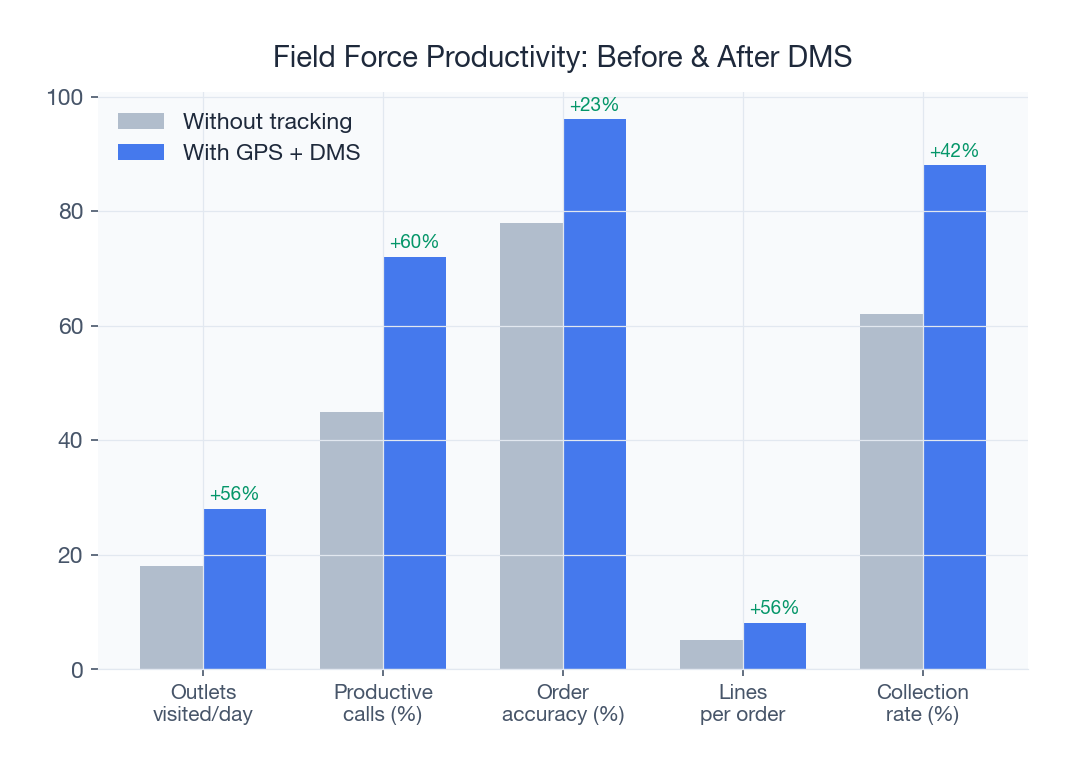
Software typically increases outlets-per-day by 40-60%, improves beat adherence from 70-85% to 95-98%, reduces missed outlets to under 3%, and cuts travel time share by 40%. Combined, these improvements drive 20-30% revenue uplift.
Beat adherence measures how well salesmen follow their assigned routes. Low adherence (fake visits, skipped outlets, wrong sequences) means lost sales and inaccurate data. Software-enabled GPS tracking pushes adherence above 95%, providing auditable proof of visits.
Yes. Modern beat planning modules integrate seamlessly with distributor management systems, linking field visits to orders, invoices, secondary sales, and scheme execution. This provides end-to-end visibility from outlet visit to revenue.
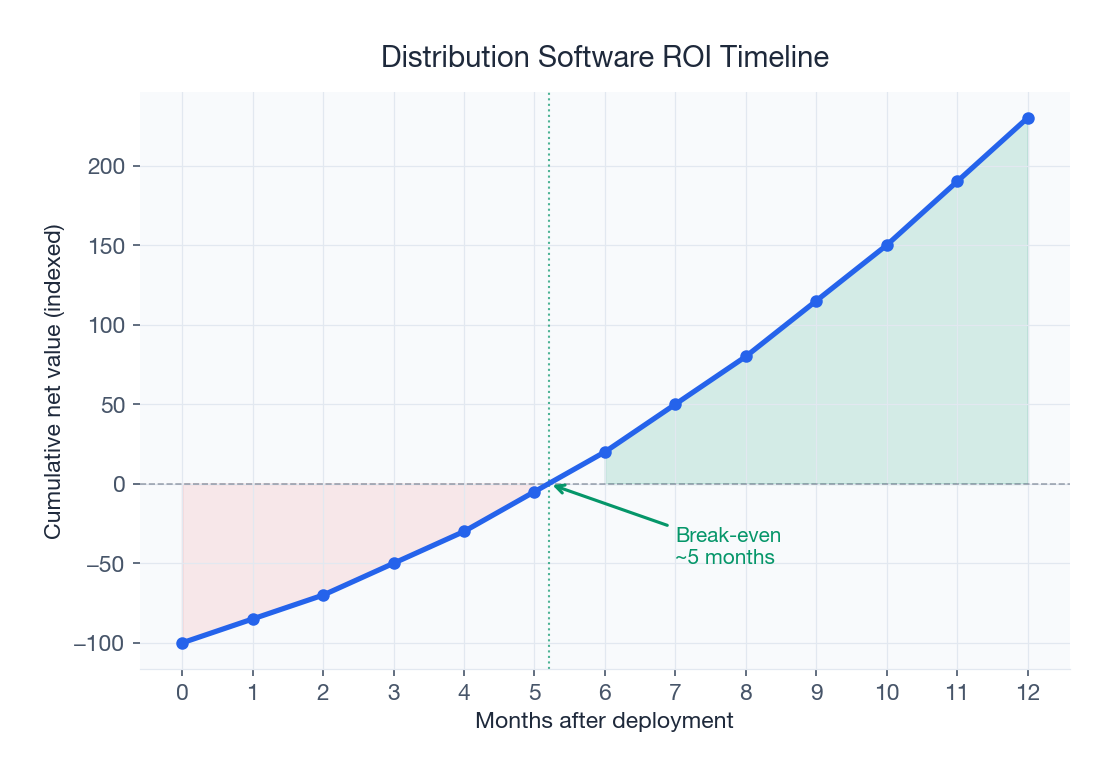
Beat planning features typically cost Rs 300-1,500 per user per month as part of a broader DMS platform. Standalone beat planning modules start around Rs 5,000/month. ROI is usually achieved within 2-4 months through productivity gains.
Beat planning is the strategic design of daily/weekly routes assigned to each salesman (which outlets to visit, how often, in what sequence). Route optimization is the tactical minimization of travel time within a specific day's beat. Both work together in a complete platform.
ميزات SpireStock ذات الصلة
حلول ذات صلة
Boost field sales team productivity with beat planning, GPS attendance, order capture, and performance analytics. Built for Indian FMCG teams.
Track and manage your retail network. Geo-tag outlets, capture secondary sales, manage beats, and monitor retailer performance. Try SpireStock.
كيانات ذات صلة
هل أنت مستعد لتبسيط عملية التوزيع؟
ابدأ تجربتك المجانية لمدة 30 يوماً واكتشف كيف يمكن لـ SpireStock تحويل عملية توزيع الألبان أو السلع الاستهلاكية الخاصة بك، من استلام الطلبات إلى استرداد الصناديق.
SpireStock Team
Distribution Technology Experts
SpireStock Team writes for SpireStock on distribution management, supply-chain optimisation and field operations for Indian dairy and FMCG brands.


