What is Scheme Leakage in FMCG?
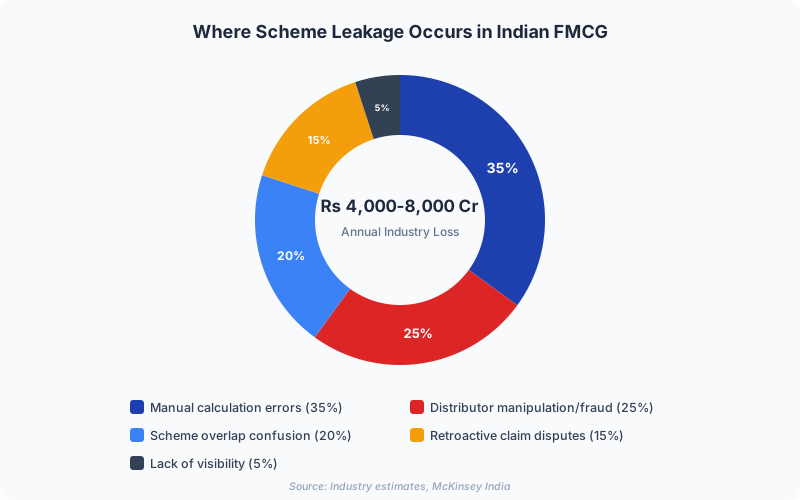
Scheme leakage refers to the unintended financial loss that occurs when trade promotion schemes are miscalculated, misapplied, misused, or exploited within FMCG distribution networks. It is one of the largest silent profit drains in Indian FMCG, costing brands an estimated Rs 4,000-8,000 crore annually across the industry. For individual mid-size brands, scheme leakage can eat 2-5% of revenue, often the difference between profit and loss.
According to a 2024 IBEF report, India's FMCG sector is projected to reach USD 220 billion by 2025, making trade promotion efficiency a board-level concern. McKinsey India estimates that trade spend accounts for 15-25% of gross revenue for most Indian FMCG companies, and when 2-5% of that leaks away, the cumulative impact is staggering.
If you run an FMCG brand and you are still managing trade schemes via Excel sheets and manual calculation, you have scheme leakage. The only question is how much. This comprehensive guide explains every type of trade scheme, the root causes and anatomy of scheme fraud, a self-assessment framework to quantify your own leakage, real-world case studies, and how modern scheme management software eliminates the problem. Ready to audit your own leakage? Book a free scheme audit with our team.
Types of Trade Schemes in Indian FMCG
Before understanding leakage, you need to understand the landscape of trade schemes that Indian FMCG brands deploy. Each scheme type has its own mechanics, and each creates different leakage vulnerabilities. A typical brand operating across Mumbai, Delhi, Chennai, and other metro cities will run multiple scheme types simultaneously.
| Scheme Type | How It Works | Typical Leakage Points |
|---|---|---|
| Flat Discount | Fixed percentage off MRP or PTR on all purchases (e.g., 5% off on all SKUs) | Applied to ineligible SKUs, miscalculated on returns, double-dipped with other discounts |
| Slab-Based Quantity Rebate | Tiered rebates based on volume milestones (e.g., buy 50 cases get 2% off, buy 100 cases get 5% off) | Round-tripping to hit slab thresholds, incorrect slab assignment, manual calculation errors at slab boundaries |
| Buy-One-Get-One (BOGO) | Free goods bundled with purchase (e.g., buy 10 get 1 free, or buy 2 get 1 free) | Free goods diverted for resale, incorrect ratio application, phantom claims for free goods not delivered |
| Target-Linked Incentive | Monetary reward for achieving monthly/quarterly volume targets (e.g., Rs 50,000 bonus for hitting 500 case target) | Inflated orders near month-end with subsequent returns, target manipulation via channel stuffing |
| Seasonal Promotion | Time-limited offers during festivals (Diwali, Navratri) or seasons (summer for beverages) | Backdated claims after scheme expiry, pre-loading stock before scheme starts, carry-forward disputes |
| Retailer-Specific Deal | Special pricing or terms for specific retailer tiers (e.g., A-class retailers get extra 2% margin) | Misclassification of retailer tier, schemes applied to wrong retailer categories, no verification of retailer status |
| Product Launch Scheme | Introductory offers for new SKUs (e.g., free display stands, higher margins for first 3 months) | Schemes continue beyond launch period, applied to existing products, launch quantity thresholds manipulated |
| Channel-Specific Scheme | Different terms for different channels: general trade vs modern trade, urban vs rural | Cross-channel diversion, stock meant for one channel sold in another, territorial arbitrage |
Most brands run 20-50 of these scheme types simultaneously, creating a complex web of overlapping rules. Without a centralized scheme engine, tracking which scheme applies to which transaction becomes virtually impossible. According to Deloitte India, the average Indian FMCG company spends 18-22% of net sales on trade promotions, making this the single largest controllable expense after raw materials.
Why Scheme Leakage Happens
1. Manual Calculation Errors
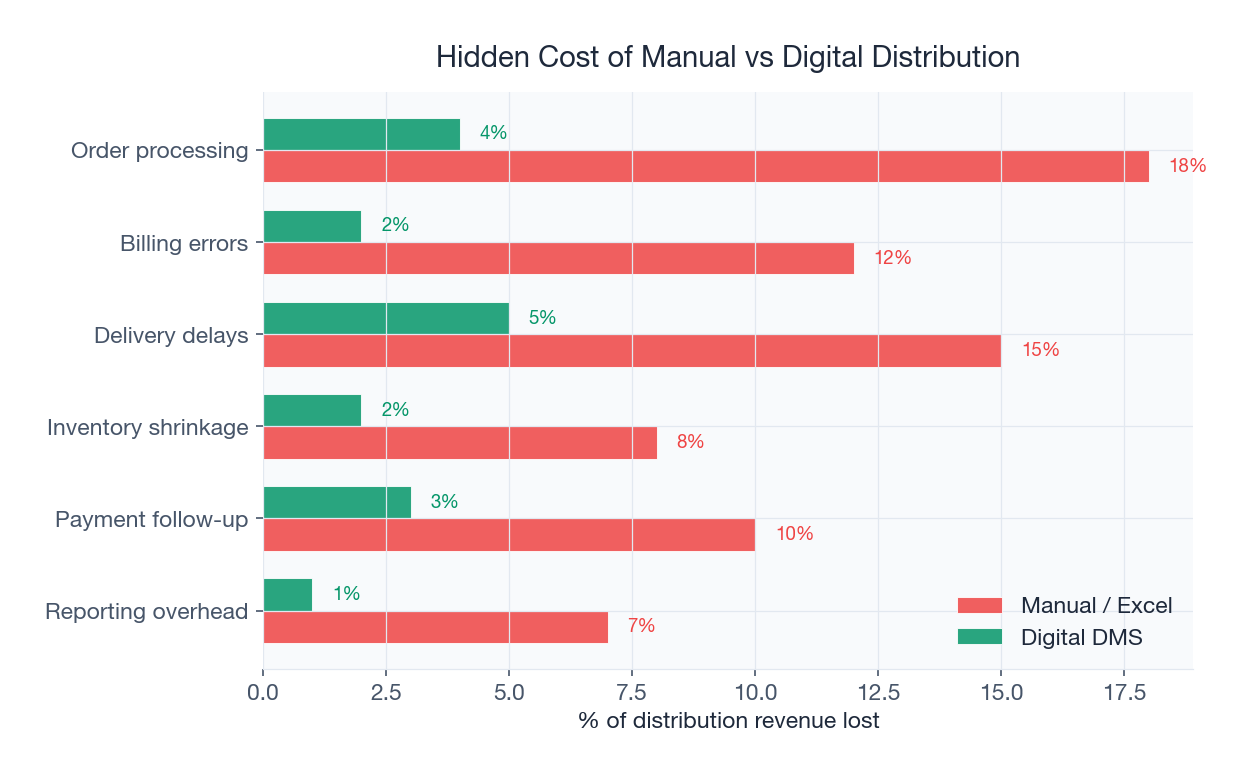
Trade schemes in Indian FMCG are complex. A typical brand runs 20-50 active schemes simultaneously across flat discounts, slab-based rebates, free goods, target incentives, seasonal promotions, and retailer-specific deals. Calculating them manually across thousands of transactions daily is a recipe for error. Studies show 10-20% of manually calculated scheme payouts contain errors, some over-paying distributors, others under-paying.
2. Scheme Overlap and Stacking
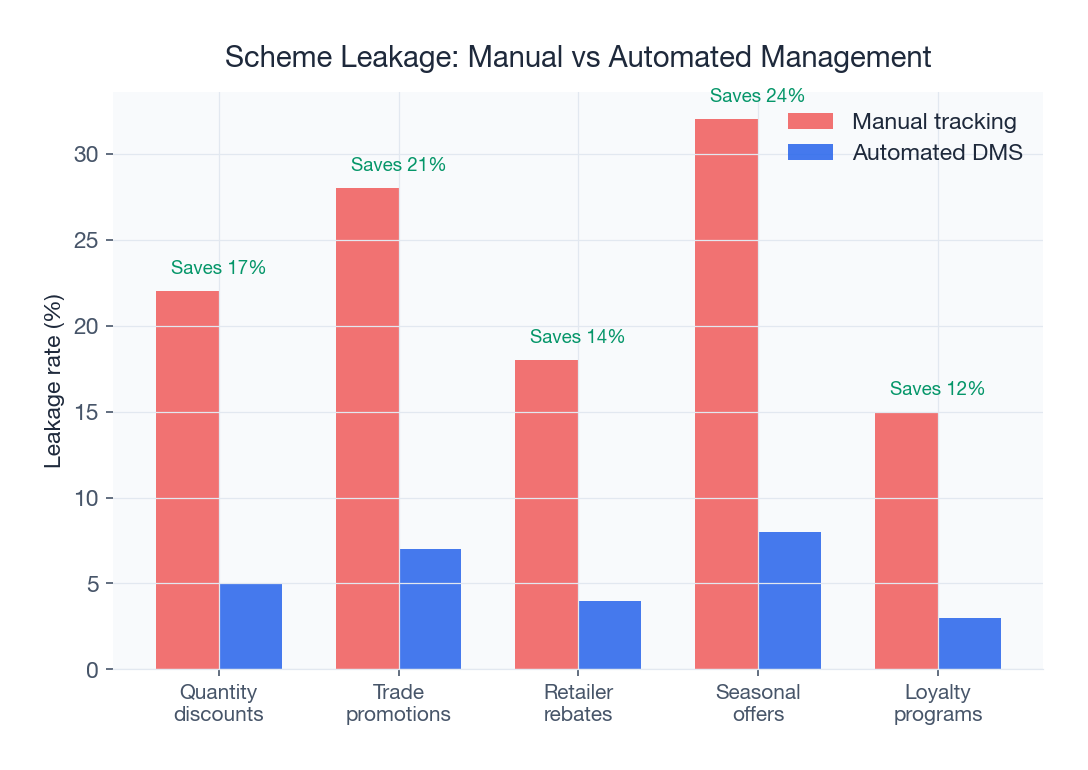
When multiple schemes apply to the same SKU, rules about stacking, exclusions, and priorities get confusing. Distributors may claim two schemes that should not combine, or miss a scheme they deserved. Without a central rules engine, disputes are constant. For example, a distributor in Pune might claim both a flat discount and a slab-based rebate on the same invoice when the brand intended them to be mutually exclusive.
3. Distributor Manipulation
Some distributors game the system. Common tactics include:
- Round-tripping: inflating orders to hit target incentives, then returning excess stock later
- Split invoicing: breaking a single order into multiple invoices to claim schemes on each
- Ghost sales: booking fake retailer sales to claim secondary sales-linked schemes
- Backdated claims: submitting claims after scheme terms have changed
Without audit trails, these tactics are nearly impossible to detect. Proper distribution tracking is the first line of defense.
4. Retroactive Claim Disputes
Distributors frequently submit retroactive claims saying "you did not pay scheme X on invoice Y three months ago." Verifying these claims from paper records is time-consuming, and brands often pay out to avoid conflict, leaking cash.
5. Lack of Visibility
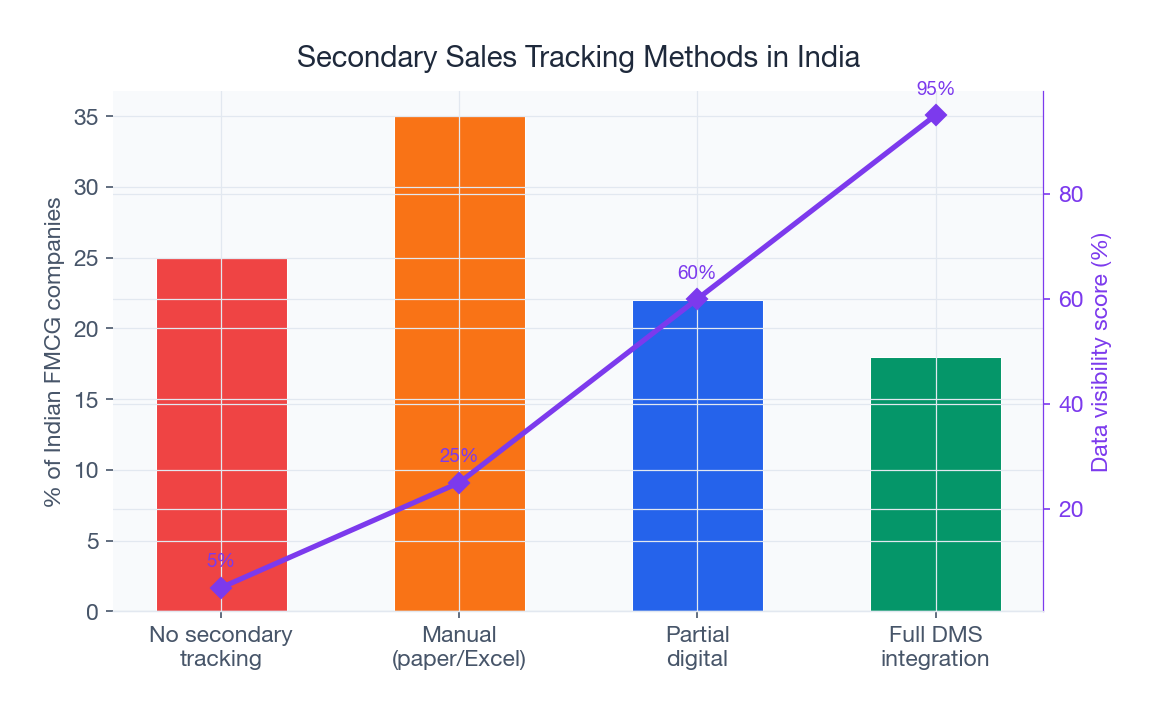
Without real-time visibility into scheme performance, marketing teams cannot tell which schemes are working, which are being abused, or which should be discontinued. Money keeps flowing out with no feedback loop. Sales analytics tools can solve this, but most brands still operate blind.
The Anatomy of a Scheme Fraud
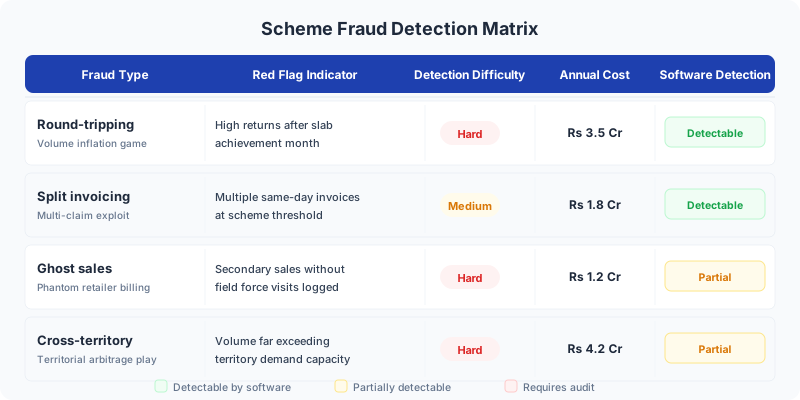
Understanding exactly how each fraud type works is essential for prevention. Below is a forensic breakdown of the four most common manipulation tactics, complete with worked examples and detection signatures.
Round-Tripping: The Volume Inflation Game
How it works: A distributor needs to buy 100 cases per month to hit a target slab that pays Rs 50 per case as an incentive. Normal demand is only 40 cases. The distributor orders 100 cases in the first week, claims the Rs 5,000 incentive, and then returns 60 cases the following month under "damaged goods" or "expiry" pretexts. Net purchase: 40 cases. Incentive earned: Rs 5,000 (should have been zero, since 40 cases falls below the 100-case slab).
Real-world scale: A mid-size brand with 300 distributors found that 8% of distributors were round-tripping. Average over-claim per distributor: Rs 1.2 lakh/month. Annual leakage from this single tactic: Rs 3.5 crore.
Detection red flags:
- Distributor consistently orders exactly at slab thresholds (100, 200, 500 cases)
- High return rates in the month following a slab achievement
- Return-to-purchase ratio exceeds 20% over a rolling 3-month period
- Orders spike in the last week of the scheme period
Split Invoicing: The Multi-Claim Exploit
How it works: A brand offers a scheme of "Rs 500 off on every invoice above Rs 20,000." A distributor with a Rs 1 lakh monthly order breaks it into 5 separate invoices of Rs 20,000 each, claiming Rs 500 on each invoice. Total scheme benefit claimed: Rs 2,500 instead of the intended Rs 500 for a single order.
Real-world scale: One FMCG distribution network discovered split invoicing across 15% of their distributor base in western India. Estimated annual over-payout: Rs 1.8 crore.
Detection red flags:
- Multiple invoices to the same distributor on the same day
- Invoice values clustered just above scheme thresholds
- Invoice count per distributor significantly higher than peers with similar volume
- Delivery addresses on split invoices are identical
Ghost Sales: The Phantom Retailer Problem
How it works: A distributor creates fictitious retailer accounts or bills against dormant retailers to show secondary sales that never happened. Since many scheme incentives (especially target-linked ones) are tied to secondary sales numbers, the distributor inflates secondary sales to claim higher payouts. Stock is either hoarded or sold through unregistered channels.
Real-world scale: A CRISIL analysis of distribution networks found that 5-12% of retailer accounts in poorly managed networks are either dormant or fictitious. For a brand paying Rs 10 crore annually in secondary sales-linked incentives, this represents Rs 50 lakh to Rs 1.2 crore in fraudulent claims.
Detection red flags:
- Retailers with no order history suddenly showing high-value purchases
- Identical retailer names or phone numbers across multiple locations
- Secondary sales reported but no field force visit logged in attendance tracking
- Retailer GPS coordinates do not match any actual retail establishment
Cross-Territory Diversion: The Arbitrage Play
How it works: Different territories often have different pricing or scheme structures due to competitive dynamics. A distributor in Territory A (where the brand offers 8% margin) buys excess stock and diverts it to Territory B (where the brand offers only 5% margin). The distributor pockets the 3% differential. This undermines the brand's territory-specific pricing strategy and creates channel conflict.
Real-world scale: A national beverage brand found that 6% of its production volume was being diverted across territories, resulting in Rs 4.2 crore in annual margin erosion and significant channel conflict between authorized distributors.
Detection red flags:
- Distributor purchases volume far exceeding territory demand
- Retailers in one territory reporting stock with batch codes assigned to another territory
- Sales velocity in the source territory far exceeds demographic-based expectations
- Sudden volume drops in the destination territory despite stable demand
Forensic Detection Summary
| Fraud Type | Primary Red Flag | Data Required | Detection Difficulty (Manual) | Detection Difficulty (Automated) |
|---|---|---|---|---|
| Round-tripping | High returns after slab achievement | Purchase + return data over 3+ months | Very High | Low |
| Split invoicing | Multiple same-day invoices at threshold | Invoice-level transaction data | High | Low |
| Ghost sales | Secondary sales without field visits | Secondary sales + GPS attendance | Very High | Medium |
| Cross-territory diversion | Volume exceeds territory demand | Territory sales + batch tracking | Very High | Medium |
The Real Cost of Scheme Leakage
| Brand Size | Annual Revenue | Typical Leakage | Annual Loss |
|---|---|---|---|
| Small | Rs 50 crore | 3-5% | Rs 1.5-2.5 crore |
| Mid-size | Rs 500 crore | 2-4% | Rs 10-20 crore |
| Large | Rs 2,000 crore | 1.5-3% | Rs 30-60 crore |
| Enterprise | Rs 10,000 crore+ | 1-2% | Rs 100-200 crore |
These numbers are conservative. Industry consultants have documented cases of 7-10% leakage in poorly managed networks. For a Rs 500 crore brand, that is Rs 35-50 crore annually, more than most brands spend on advertising. NielsenIQ data shows that only 35-40% of trade promotion spend in India delivers measurable incremental volume, meaning the majority of spend is either leaked or unproductive.
Quantifying Your Leakage: A Self-Assessment Framework
Most FMCG brands know they have scheme leakage but have no idea how much. Use this 5-question diagnostic to estimate your exposure. Score each question honestly, then total your points.
Question 1: How do you calculate scheme payouts?
- 0 points: Fully automated via scheme engine software with no manual intervention
- 5 points: Semi-automated, schemes configured in software but some manual adjustments
- 10 points: Primarily Excel-based with manual calculation for each distributor
- 15 points: Entirely manual, calculated by accountants from paper invoices
Question 2: Do distributors submit retroactive claims?
- 0 points: Never, all claims are settled at invoice time
- 3 points: Rarely (less than 5% of payouts are retroactive)
- 8 points: Sometimes (5-20% of payouts are retroactive)
- 15 points: Frequently (more than 20% of payouts are retroactive or disputed)
Question 3: Can you verify secondary sales digitally?
- 0 points: Yes, real-time secondary sales captured via retailer tracking app
- 5 points: Partially, some secondary data from field force reports
- 10 points: No, we rely on distributor-reported secondary sales
- 15 points: We do not track secondary sales at all
Question 4: Do you have audit trails for every scheme payout?
- 0 points: Complete digital audit trail with timestamp and user for every payout
- 5 points: Partial trails, some digital records but gaps exist
- 10 points: Paper-based records that are difficult to retrieve
- 15 points: No systematic audit trail exists
Question 5: Do your schemes overlap?
- 0 points: Clear stacking rules enforced by software, no unintended overlap
- 5 points: Some overlap exists but is generally understood by the team
- 10 points: Significant overlap, disputes about scheme stacking are common
- 15 points: We are not sure which schemes overlap and which do not
Score Interpretation
| Score | Leakage Risk | Estimated Leakage | Recommended Action |
|---|---|---|---|
| 0-15 | Low | Less than 1% of scheme spend | Maintain current systems, focus on optimization |
| 16-35 | Moderate | 1-3% of scheme spend | Implement automated scheme engine within 6 months |
| 36-55 | High | 3-5% of scheme spend | Urgent: deploy scheme management software immediately |
| 56-75 | Critical | 5-10% of scheme spend | Emergency audit required. Contact us for a free assessment |
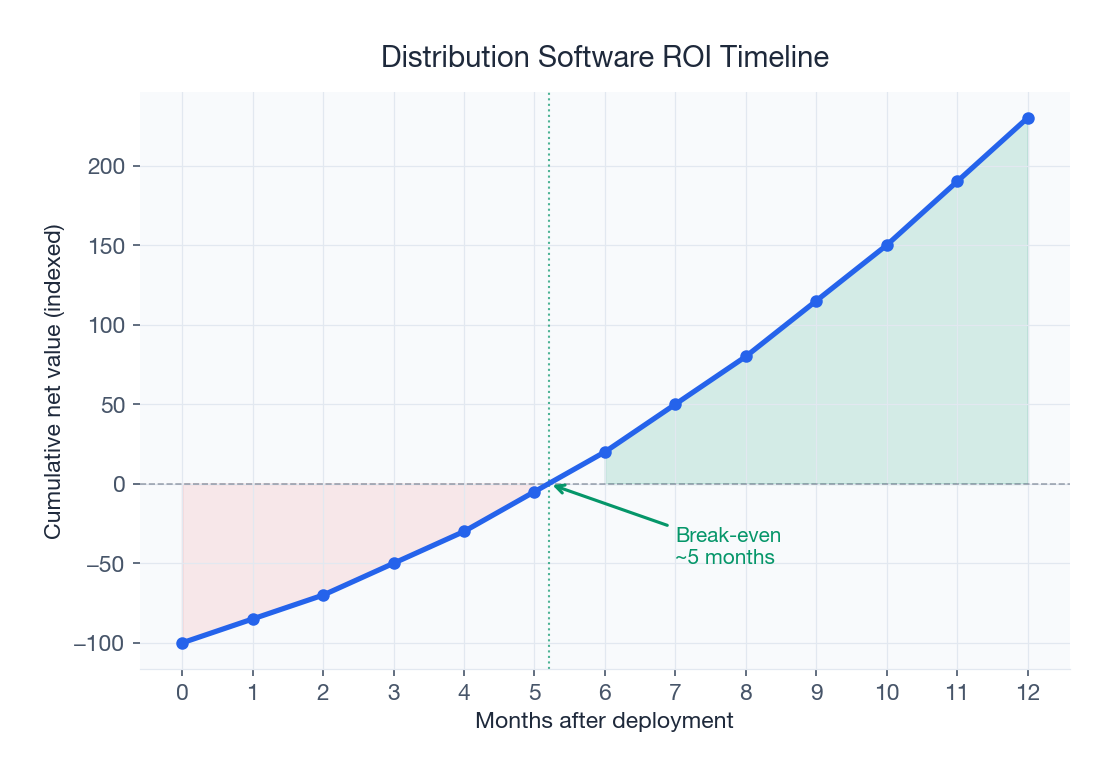
If you scored 36 or above, you are likely losing crores annually. The good news: automated scheme management typically pays for itself within 1-3 months through leakage reduction alone. For a detailed understanding of how distribution management systems work, read our complete DMS guide.
How Scheme Management Software Prevents Leakage
1. Centralized Rules Engine
A scheme engine encodes every scheme as a set of rules: eligibility, calculation logic, start and end dates, caps, exclusions, and stacking rules. Every invoice is evaluated against these rules automatically. There is no room for manual error because there is no manual calculation.
2. Automatic Application
When an order is placed via the order management system or an invoice generated through the invoice and billing module, applicable schemes are identified and applied automatically. Distributors see exactly what they earned, and brands see exactly what they paid. No surprises.
3. Audit Trails
Every scheme application is logged with timestamp, user, and calculation details. Retroactive claims can be verified in seconds. Distributor manipulation becomes nearly impossible because every action leaves a trail.
4. Secondary Sales Linkage
Schemes linked to secondary sales (distributor to retailer) require visibility into actual retailer transactions. A retailer tracking system captures secondary sales via field force mobile apps, ensuring schemes are paid on real sales, not ghost ones.
5. Real-Time Dashboards
Analytics dashboards show scheme performance in real time: which schemes are driving volume, which are being abused, and which have the best ROI. Marketing teams can adjust schemes mid-month based on data, not guesswork.
6. Anti-Fraud Alerts
Rule-based alerts flag suspicious patterns: unusually high claim rates, round-tripping signatures, split invoicing, and backdated submissions. Compliance teams can investigate before payouts are released.
Scheme ROI Measurement: Beyond Leakage Prevention
Preventing leakage is necessary but insufficient. The larger opportunity lies in measuring and optimizing the return on every rupee of scheme spend. Most Indian FMCG brands cannot answer a basic question: "For every Rs 1 we spend on trade promotions, how much incremental revenue do we generate?"
Net Lift Analysis Methodology
Net lift analysis measures the true incremental impact of a scheme by comparing actual sales during the scheme period against a baseline of what would have happened without the scheme. The methodology involves:
- Establish baseline: Calculate average sales velocity for the SKU/territory combination over the 3 months prior to the scheme
- Measure total sales: Record actual sales during the scheme period
- Calculate gross lift: Total sales minus baseline sales gives gross incremental volume
- Adjust for pull-forward and pantry loading: Subtract sales dip in the post-scheme period (typically 2-4 weeks after scheme ends) to account for demand that was merely shifted, not created
- Calculate net lift: Gross lift minus pull-forward adjustment gives true incremental volume
- Compute ROI: (Net incremental margin) divided by (total scheme cost) gives scheme ROI
Industry Benchmarks for Scheme ROI
| Performance Level | Scheme ROI | % of Indian FMCG Brands | Characteristics |
|---|---|---|---|
| Best-in-class | 3-4x | 5-8% | Fully automated, data-driven scheme design, continuous optimization |
| Above average | 2-3x | 15-20% | Partial automation, regular scheme reviews, some analytics |
| Industry average | 1.2x | 40-50% | Manual management, periodic reviews, limited visibility |
| Below average | Less than 1x | 25-35% | No measurement, ad-hoc schemes, significant leakage |
The gap between best-in-class (3-4x ROI) and average (1.2x ROI) represents an enormous opportunity. For a brand spending Rs 50 crore on trade promotions annually, moving from average to best-in-class would generate Rs 90-140 crore in additional incremental revenue from the same spend. McKinsey India estimates that systematic trade promotion optimization can improve FMCG operating margins by 200-400 basis points.
Identifying Unproductive Schemes
Net lift analysis typically reveals that 30-40% of scheme spend is unproductive, subsidizing sales that would have happened anyway. Common culprits include:
- Evergreen schemes that have been running so long they are priced into distributor expectations
- Category-wide discounts on SKUs that are already market leaders with inelastic demand
- Loyalty rewards to distributors who have no viable alternative brand to switch to
- Seasonal schemes on products with predictable seasonal demand spikes regardless of promotion
With sales analytics, brands can identify these unproductive schemes and reallocate the budget to schemes that actually drive growth, such as new product launches, competitive displacement promotions, or geographic expansion incentives.
Real-World Case Studies
Case Study 1: Mid-Size Biscuit Brand in Western India
A mid-size biscuit brand distributing through 250 distributors in western India estimated their scheme leakage at 4% of revenue, or Rs 8 crore annually. After deploying SpireStock's scheme engine:
- Scheme calculation errors dropped to zero
- Retroactive disputes reduced by 95%
- Round-tripping was detected and stopped for 12 distributors
- Scheme payout reduced by Rs 7.2 crore in the first year
- Distributor satisfaction actually improved because payouts became transparent
The brand used the Rs 7.2 crore savings to fund a new product launch campaign, which generated Rs 22 crore in first-year revenue.
Case Study 2: Dairy Brand in Maharashtra
A dairy distribution company in Maharashtra with Rs 800 crore in annual revenue was running 62 active schemes across 400+ distributors. Their challenges were acute because dairy products are perishable: short shelf life means returns are frequent, and distinguishing legitimate returns from round-tripping is extremely difficult.
Key problems identified:
- 32% of scheme payouts were calculated manually by 8 accountants, taking 12 working days per month
- Return rate was 18% (industry benchmark for dairy: 8-10%), suggesting significant round-tripping
- 14 distributors were claiming freshness-linked incentives on products that had already crossed 50% of shelf life at delivery
- Scheme overlap between festive promotions and quarterly targets was causing Rs 40 lakh/month in double payouts
After implementing SpireStock:
- Consolidated 62 schemes into 18 standardized templates
- Return rate dropped from 18% to 9% within 4 months as round-tripping became detectable
- Monthly scheme processing time reduced from 12 days to real-time (automated)
- Annual leakage reduction: Rs 14.8 crore (1.85% of revenue recovered)
- Freed up 6 accountants for higher-value financial analysis work
The dairy brand's CFO noted that the leakage savings alone were larger than their annual IT budget. Read more about dairy-specific distribution challenges in our dairy distribution guide.
Case Study 3: FMCG Snacks Company in Tamil Nadu
A fast-growing snacks company based in Chennai with 1,200 distributors across Tamil Nadu, Karnataka, and Andhra Pradesh was scaling rapidly but bleeding money through scheme leakage. Their annual revenue was Rs 450 crore, and trade promotion spend was Rs 72 crore (16% of revenue).
Key problems identified:
- Cross-territory diversion was rampant: distributors in Tamil Nadu (where higher margins were offered to compete with local brands) were diverting stock to Karnataka distributors
- Ghost sales accounted for an estimated 8% of reported secondary sales in rural beats
- Split invoicing was widespread, with some distributors generating 15-20 invoices per day instead of 2-3
- The company had no visibility into which of their 47 active schemes was actually driving volume vs simply leaking money
After implementing SpireStock:
- Deployed distribution tracking with batch-level territory tagging, making diversion immediately detectable
- Integrated field force GPS tracking with secondary sales claims, eliminating ghost sales within 2 months
- Anti-split invoicing rules automatically consolidated same-day orders from the same distributor
- Net lift analysis revealed that 19 of 47 schemes (40%) had negative or negligible ROI
- Annual savings: Rs 11.3 crore in leakage prevention + Rs 8.7 crore in unproductive scheme elimination
- Total impact: Rs 20 crore annually on a Rs 72 crore trade promotion budget (28% improvement in efficiency)
The company used the van sales management module alongside scheme automation, enabling real-time scheme application even for cash van deliveries in rural areas.
Industry Benchmarks and Consultant Perspectives
Understanding how your scheme management compares to industry standards is critical for making the business case for automation.
McKinsey India: Trade Promotion Effectiveness
McKinsey's research on Indian FMCG trade promotion effectiveness found that top-performing companies achieve 3-4x ROI on trade spend while average companies barely break even at 1.2x. The key differentiator is not how much companies spend, but how they manage it. McKinsey recommends three pillars: granular data capture at the transaction level, automated rule-based execution, and continuous performance measurement with rapid reallocation.
NielsenIQ: Scheme Penetration Data
NielsenIQ's India FMCG reports indicate that trade promotion intensity has increased by 35% over the past five years, with brands spending more on schemes to maintain market share in an increasingly competitive landscape. However, scheme effectiveness (measured as incremental volume per rupee of trade spend) has declined by 20% in the same period. This suggests that brands are spending more but getting less, a classic sign of scheme proliferation without adequate management infrastructure.
Deloitte India: Channel Distribution Margins
Deloitte India's analysis of FMCG channel economics reveals that effective distributor margins in India range from 3-8% depending on the category and region. When scheme leakage inflates these margins by 1-3 percentage points, it directly erodes the brand's profitability. Deloitte recommends that FMCG companies treat trade promotion management as a strategic capability rather than an operational task, investing in technology and talent accordingly.
FICCI-CII FMCG Reports
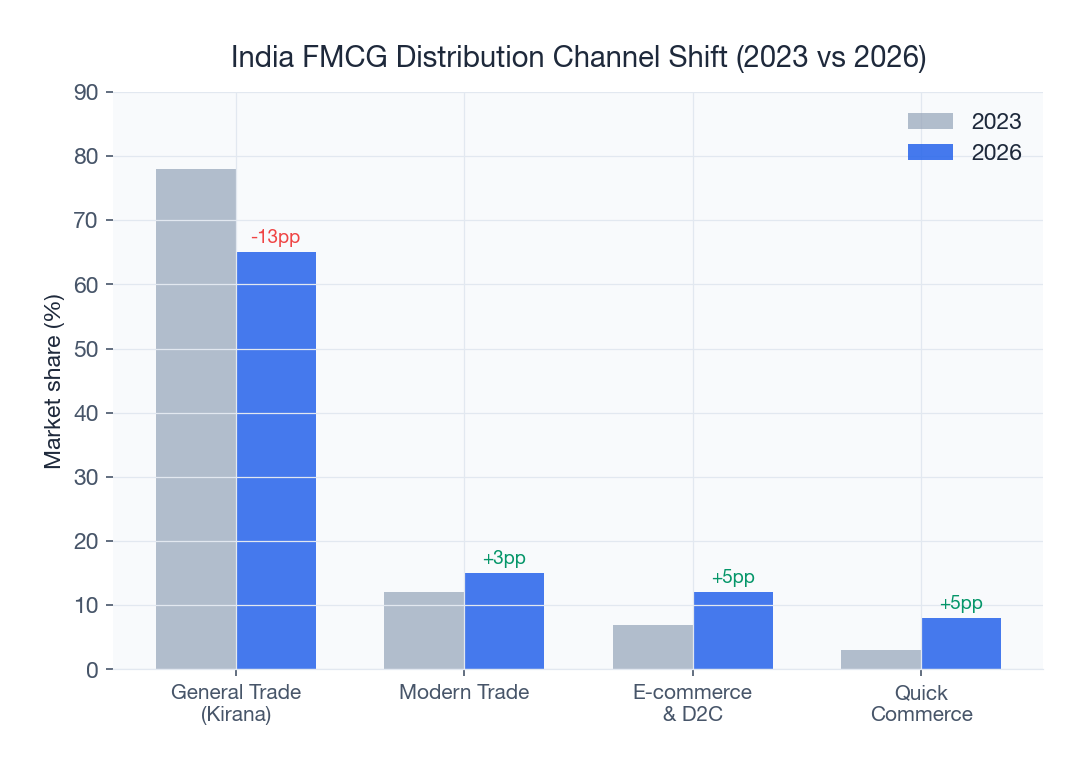
Industry associations FICCI and CII have highlighted in multiple annual reports that Indian FMCG companies lag behind global peers in trade promotion management maturity. While global FMCG leaders achieve 85-90% scheme execution accuracy, Indian companies average 60-70%. The reports recommend digital transformation of trade promotion management as one of the top three priorities for Indian FMCG competitiveness.
Building a Scheme Governance Framework
Technology alone is not enough. Brands need an organizational framework for scheme governance to prevent leakage systemically. Here is a proven framework used by top-performing Indian FMCG companies.
1. Scheme Approval Workflows
Every new scheme should go through a structured approval process before launch:
- Proposal: Regional sales team proposes scheme with target objective, expected volume lift, and budget
- Financial review: Finance team validates budget availability and projected ROI
- Overlap check: Scheme engine automatically checks for conflicts with existing schemes
- Approval: Marketing head or trade marketing manager approves based on data
- Configuration: Scheme is configured in the scheme engine with all rules encoded
- Pilot: Run in one territory for 2-4 weeks before full rollout
2. Regional Budget Caps
Set hard budget limits for scheme spend by region, channel, and category. Without caps, regional teams tend to over-promote to meet short-term targets, creating a "scheme arms race" that erodes margins. A good rule of thumb: total scheme spend should not exceed 18-20% of net sales for any region. Brands operating in Ahmedabad, Mumbai, and Delhi often need different budget allocations reflecting competitive intensity in each market.
3. Performance Reviews
Conduct monthly scheme performance reviews at the regional level and quarterly reviews at the national level. Key metrics to track:
- Scheme ROI: Incremental revenue per rupee of scheme spend
- Leakage rate: Percentage of scheme payouts that cannot be linked to legitimate sales
- Execution accuracy: Percentage of schemes applied correctly at the transaction level
- Claim resolution time: Average days to resolve distributor scheme disputes
- Scheme utilization: Percentage of eligible distributors who actually participated
4. Scheme Sunset Policies
One of the biggest sources of leakage is scheme proliferation: old schemes that were never formally discontinued. Implement a mandatory sunset policy:
- Every scheme must have a defined end date (no open-ended schemes)
- Schemes older than 6 months require a formal review and re-approval
- Schemes with ROI below 1.5x are automatically flagged for discontinuation
- Maximum active schemes per region should be capped at 15-20
Red flag: If your brand currently has 50+ active schemes, you almost certainly have redundant, conflicting, or forgotten schemes that are leaking money. Consolidation to 15-20 well-managed schemes typically improves both effectiveness and control.
5. Preventing Scheme Proliferation
Scheme proliferation occurs when regional teams create ad-hoc schemes to solve local problems without considering the systemic impact. Symptoms include:
- No one in the organization can list all active schemes
- Two or more schemes have contradictory objectives for the same SKU
- Distributors cannot understand what they are entitled to
- Finance team spends more time on scheme reconciliation than financial analysis
The solution is a combination of technology (centralized scheme management) and governance (the approval workflows and sunset policies described above). Brands that implement both typically reduce active scheme count by 40-60% while improving overall scheme effectiveness.
The Scheme Engine: Key Capabilities
- UI-based scheme configuration: marketing teams build schemes without IT help
- Multi-scheme stacking rules: control which schemes combine and which do not
- Target-based slabs: tiered rebates based on volume milestones
- Retailer-specific schemes: different rules for different retailer types
- Time-bound promotions: automatic start and end based on date/time
- Product and SKU-level granularity: schemes per brand, variant, or pack size
- Reversal and recall logic: automatic reversal if scheme terms are violated
- Geo-fenced execution: schemes limited to specific territories or cities
- Channel-specific rules: separate scheme tracks for general trade, modern trade, and e-commerce
- Real-time budget tracking: live scheme spend vs budget with automatic alerts at 80% and 100% utilization
Implementation Steps
- Audit current schemes: document every active scheme, its rules, and its performance. Use the self-assessment framework above to estimate current leakage
- Standardize scheme types: simplify from 50+ ad-hoc schemes to 8-12 standard templates that cover all legitimate use cases
- Configure in the scheme engine: marketing team encodes rules in the software, including stacking rules, exclusions, and budget caps
- Integrate with order and billing: connect the scheme engine to your order management and invoice billing systems for automatic application
- Pilot in one region: test for 30-45 days before full rollout, comparing scheme accuracy and distributor feedback
- Train distributors: show them how schemes now apply automatically and how they can view their scheme earnings in real time
- Monitor and refine: use analytics to optimize scheme ROI and adjust the governance framework based on learnings
For a comprehensive overview of the entire distribution management software landscape in India, read our distribution management software guide.
Eliminate scheme leakage with SpireStock. Our scheme engine has saved Indian FMCG brands over Rs 200 crore in leakage. Book a free scheme audit today.
The Future: AI-Powered Scheme Optimization
The next frontier in scheme management goes beyond preventing leakage to actively optimizing scheme design and execution using artificial intelligence. Here is what leading FMCG brands are beginning to deploy and what will become mainstream within the next 2-3 years.
Predictive Scheme Design
Instead of designing schemes based on intuition or historical patterns, AI models analyze retailer-level demand data, competitive dynamics, seasonal patterns, and distributor behavior to recommend optimal scheme parameters. For example, the AI might recommend a 3% slab rebate at 80 cases (not 100) for distributors in Pune because data shows that 80 cases is the inflection point where most distributors can stretch, while 100 cases is too ambitious and leads to round-tripping.
Automated A/B Testing of Scheme Variants
Brands can run controlled experiments by deploying scheme variant A in one set of territories and variant B in a matched set, then measuring incremental volume lift, leakage rates, and ROI for each variant. The system automatically identifies the winning variant and recommends rollout to remaining territories. This is standard practice in digital marketing but virtually non-existent in trade promotion management today.
Real-Time Budget Reallocation
AI-powered distributor management systems can monitor scheme performance in real time and automatically shift budget from underperforming schemes to outperforming ones. If a seasonal promotion in South India is generating 4x ROI while a similar promotion in North India is generating only 0.8x ROI, the system can reallocate budget mid-month to maximize overall returns.
Dynamic Pricing Tied to Scheme Performance
The most advanced systems will integrate scheme management with pricing optimization, adjusting base prices and scheme parameters simultaneously to maximize margin while maintaining competitive positioning. This requires real-time market intelligence, which is becoming feasible as more secondary sales data is captured digitally through platforms like SpireStock.
Anomaly Detection and Fraud Prevention
Machine learning models trained on historical transaction data can detect fraud patterns that rule-based systems miss. For example, an ML model might identify a subtle pattern where a distributor consistently places larger orders on Fridays (when the compliance team is less vigilant) and returns goods on Mondays through a different warehouse. These complex, multi-step fraud patterns are invisible to traditional rule-based alerts but detectable through pattern recognition.
Frequently Asked Questions
How long does it take to implement a scheme engine?
Typical implementation takes 4-8 weeks: 1-2 weeks for scheme documentation and standardization, 1-2 weeks for system configuration, 1-2 weeks for integration with existing order management and billing systems, and 1-2 weeks for pilot testing. Full ROI is typically visible within 3 months of go-live.
What if distributors resist the change?
Resistance is common but short-lived. Distributors who benefit from leakage (a minority) will push back. But the majority of distributors actually prefer automated schemes because it eliminates disputes, ensures timely payouts, and provides transparency. The key is communicating the "what is in it for them" narrative: faster payments, no disputes, clear visibility of earnings.
Can small brands afford scheme management software?
Absolutely. For a brand with even Rs 50 crore revenue and 3% leakage, the annual loss is Rs 1.5 crore. SpireStock's scheme engine costs a fraction of that. Check our pricing plans for details. The payback period is typically 1-3 months.
How does this integrate with our existing ERP?
SpireStock provides API-based integration with all major Indian ERP systems (Tally, SAP B1, Oracle NetSuite, Microsoft Dynamics). Scheme data flows seamlessly into your accounting system, eliminating double entry and reconciliation overhead.
Conclusion
Scheme leakage is one of the largest preventable profit drains in Indian FMCG, costing the industry Rs 4,000-8,000 crore annually. But leakage is only half the problem. The larger opportunity lies in optimizing scheme ROI, moving from the industry average of 1.2x to the best-in-class benchmark of 3-4x through data-driven scheme design, automated execution, and continuous performance measurement.
The path forward requires both technology and governance: a centralized scheme engine to automate calculation and prevent fraud, combined with organizational frameworks for scheme approval, budget management, performance review, and sunset policies. Brands that make this investment recover their costs within months and gain a structural advantage over competitors who continue to leak money through manual processes.
Whether you are a Rs 50 crore brand just starting to formalize your distribution or a Rs 5,000 crore enterprise seeking to optimize an already sophisticated network, the principles are the same: digitize, automate, measure, and optimize. Explore our scheme engine feature, scheme management solutions, or pricing plans to get started. For personalized guidance, book a free consultation with our distribution technology experts.
For related reading, see our guides on what a DMS is and why you need one, distribution management software in India, van sales management, and beat planning for FMCG.
For the complete picture, see our scheme management guide.
Sources & References
Frequently Asked Questions
Scheme leakage is the unintended financial loss from miscalculated, misapplied, or manipulated trade promotion schemes. It typically costs Indian FMCG brands 1-5% of revenue, crores annually, through manual calculation errors, distributor manipulation, retroactive claims, and lack of visibility.
For a Rs 500 crore mid-size FMCG brand, typical leakage is 2-4% of revenue, or Rs 10-20 crore annually. Large brands lose Rs 30-60 crore, and enterprise brands Rs 100-200 crore. Industry-wide, scheme leakage costs Rs 4,000-8,000 crore per year.
Main causes are manual calculation errors (10-20% error rate), scheme overlap and stacking confusion, distributor manipulation (round-tripping, split invoicing, ghost sales), retroactive claim disputes, and lack of real-time visibility into scheme performance.
A scheme engine encodes all scheme rules, applies them automatically to every invoice, logs audit trails, integrates with secondary sales data, provides real-time dashboards, and fires anti-fraud alerts. This eliminates manual errors and makes manipulation nearly impossible.
Yes. Rule-based alerts flag suspicious patterns like round-tripping (inflated orders with later returns), split invoicing (breaking orders to multi-claim schemes), ghost sales (fake secondary sales), and backdated claims. Compliance teams can investigate before payouts are released.
Most Indian FMCG brands recover software costs within 1-3 months purely through scheme leakage reduction. A brand saving Rs 10 crore annually in leakage recoups Rs 25-50 lakh software investment in weeks, not months.
Related SpireStock Features
Related Industries
Related Solutions
Automate trade schemes, incentives, and promotional offers. Flat, bulk-pack, quantitative, and FOC schemes with ROI tracking. Try SpireStock.
Manage your entire distributor network digitally. Onboarding, credit limits, outstanding tracking, and performance analytics. Start free trial.
Related Entities
Ready to Streamline Your Distribution?
Start your free 14-day trial and see how SpireStock can transform your dairy, FMCG or consumer-goods distribution operation, from order capture to crate recovery.

SpireStock Team
Distribution Technology Experts
SpireStock Team writes for SpireStock on distribution management, supply-chain optimisation and field operations for Indian dairy and FMCG brands.