What is Beat Planning in FMCG?
Beat planning in FMCG is the process of designing and assigning daily sales routes, called beats, that field salesmen follow to visit retail outlets in an organized, repeatable manner. Think of a beat as a fixed sequence of 50-150 retailers that a salesman visits on a specific day of the week. Over a week or fortnight, a salesman covers multiple beats that collectively include every retailer in his assigned territory.
Beat planning is how Indian FMCG brands ensure that every retailer in every corner of the country gets visited regularly, whether it's a kirana in Delhi's Chandni Chowk, a paan shop in Hyderabad's old city, or a medical store in a tier-3 town. Without beat planning, field sales would descend into chaos. With effective beat planning, brands achieve consistent coverage, predictable revenue, and scalable distribution. Want to see modern beat planning in action? Request a demo.
Why Beat Planning Exists
India has over 1.5 crore retail outlets, the largest retail base in the world. A typical FMCG brand sells through 500,000 to 2 million of these outlets via a network of distributors and field sales teams. No salesman can visit every retailer every day, there are simply too many. So brands divide territories into beats, assign each beat a visit frequency, and send salesmen on a rotating schedule.
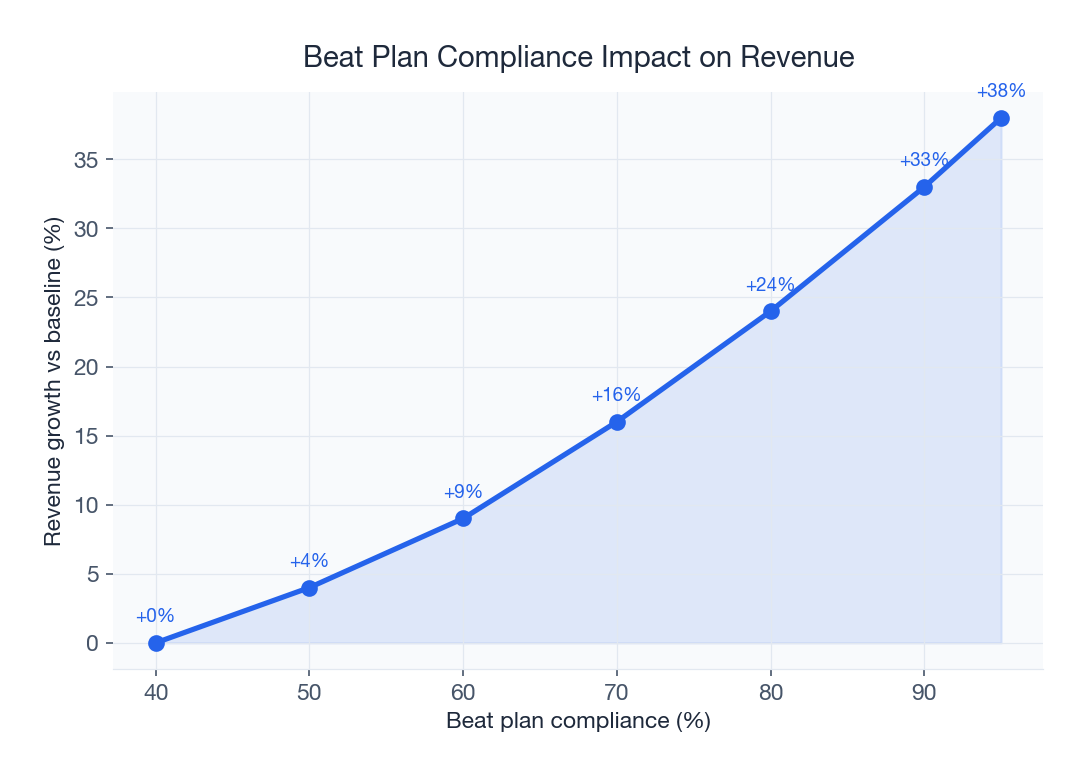
This system has evolved over 50+ years of Indian FMCG distribution and remains the backbone of how brands reach retailers at scale. Modern beat planning software makes the system vastly more efficient, but the core concept hasn't changed.
Key Concepts in Beat Planning
1. Beat
A beat is a defined group of retailers that a salesman visits in a single day or over a defined period. A beat typically has 50-150 outlets depending on density and product category. Bakery beats (which require daily visits) are smaller. FMCG beats (weekly visits) are larger.
2. Permanent Journey Plan (PJP)
A Permanent Journey Plan (PJP) is the master schedule that assigns each beat to specific days of the week. For example: Monday = Beat A (50 outlets in south Mumbai), Tuesday = Beat B (60 outlets in Bandra), Wednesday = Beat C (55 outlets in Andheri). A salesman follows the PJP weekly, ensuring consistent retailer contact.
3. Outlet Frequency
How often each retailer is visited. High-value retailers may be visited twice a week; low-value retailers monthly. Outlet frequency balances sales potential with resource constraints.
4. Beat Adherence
The percentage of planned outlets a salesman actually visits on a given day. High beat adherence (95%+) means the system works. Low adherence indicates planning problems or execution failure. Modern GPS-based tracking pushes adherence above 95%.
5. Productivity Metrics
Outlets per day (OPD), lines per call (LPC), strike rate (outlets that ordered vs visited), and average order value (AOV). These KPIs determine field force effectiveness.
How Beat Planning Works: Step-by-Step
Step 1: Map the Retailer Universe
Create a master list of every retailer in your territory with address, GPS coordinates, category (grocery, pharmacy, HoReCa, etc.), and historical sales. This is the foundation of all beat planning.
Step 2: Segment by Frequency
Classify retailers by visit frequency based on sales potential. High-volume outlets get more frequent visits; low-volume outlets get less.
Step 3: Create Beats
Group retailers into beats based on geography and visit frequency. Each beat should balance outlet count, travel distance, and sales potential so workload is even across salesmen.
Step 4: Assign Salesmen
Assign each beat to a specific salesman based on territory familiarity, product expertise, and capacity.
Step 5: Build the PJP
Map beats to days of the week. Ensure every retailer is covered at its required frequency over the cycle.
Step 6: Execute and Monitor
Salesmen follow the PJP daily. Managers monitor beat adherence, productivity, and sales via analytics dashboards.
Step 7: Refine Continuously
Review beats monthly or quarterly. Add new retailers, remove closed ones, rebalance workload.
Types of Beats in Indian FMCG
| Beat Type | Frequency | Outlets | Example Categories |
|---|---|---|---|
| Daily beat | Every day | 80-150 | Bread, milk, curd, newspapers |
| Alternate day | 2-3x per week | 70-120 | Biscuits, snacks, soft drinks |
| Weekly beat | Once a week | 50-100 | Personal care, home care |
| Fortnightly beat | Every 2 weeks | 40-80 | Premium products, slow-moving SKUs |
| Monthly beat | Once a month | 30-60 | Specialty or seasonal products |
Manual vs Software-Driven Beat Planning
Traditional beat planning is manual, Area Sales Managers draw routes on paper maps, memorize retailer lists, and adjust based on gut feel. This approach works for small operations but breaks down at scale. Problems include:
- Uneven workload (one salesman has 200 retailers, another has 80)
- Missed outlets (no systematic tracking of coverage)
- Duplicate visits (multiple salesmen visit the same outlet)
- Slow updates (beats drift from reality over time)
- No accountability (no way to verify salesmen actually visited)
Beat planning software solves all of these problems through automation, GPS tracking, and data-driven optimization.
Beat Planning and Secondary Sales
Beat planning directly impacts secondary sales, the sales from distributors to retailers. A well-planned beat maximizes retailer coverage, increases order frequency, and drives higher per-outlet revenue. Studies show that distributors using software-driven beat planning see 15-25% lift in secondary sales within 3-6 months. For more on this, read our DMS guide.
Real-World Example: A Biscuit Brand's Beat System
A national biscuit brand selling through 1.2 million retail outlets uses the following beat structure:
- 4,500 salesmen across 800 distributors
- Each salesman manages 250-350 retailers
- Each retailer is visited weekly (high-volume) or bi-weekly (low-volume)
- Each beat has 60-90 outlets (daily coverage)
- Daily productivity target: 80 visits, 65 productive calls, Rs 1.2 lakh sales
Multiply this across 4,500 salesmen operating on a PJP, and you get 3.6 lakh daily visits generating over Rs 50 crore in daily secondary sales. Beat planning is literally the operational backbone of this brand's business.
Common Beat Planning Mistakes
- Stale retailer database, routes drift when new outlets aren't added
- One-size-fits-all frequency, treating all retailers the same wastes effort
- Ignoring geography, beats that span too much distance waste travel time
- No accountability, salesmen fake visits when there's no GPS tracking
- Infrequent review, beats should be reviewed quarterly, not annually
Beat Planning for Different Categories
- Bakery: daily beats, 80-150 outlets, short product windows
- Dairy: daily milk delivery + weekly curd/butter beats
- Beverages: alternate-day or weekly beats, van sales model
- FMCG: weekly beats, pre-sales or van sales mix
- Fresh produce: daily HoReCa beats, weekly retail beats
Modernize your beat planning with SpireStock. From regional distributors to national brands, we power Indian FMCG field sales at scale. Book a free demo today.
The Future: AI-Driven Dynamic Beats
The next generation of beat planning uses AI to dynamically adjust beats based on real-time signals, retailer behavior, weather, local events, and inventory levels. Static PJPs will give way to intelligent beats that adapt continuously. Brands that invest in AI-driven beat planning now will have a significant productivity advantage within 2-3 years.
Beat Planning at a Glance
Reference figures for Indian general trade. Note the distinction the numbers turn on: a sales call where a rep takes an order is a slower activity than a delivery drop, so daily-delivery beats carry far more outlets than pre-sales beats.
| Parameter | Typical Indian Benchmark |
|---|---|
| Sales calls per rep per day (urban pre-sales) | 30-45 |
| Sales calls per rep per day (rural) | 18-25, travel-constrained |
| Delivery drops per day (dairy, bread, daily beats) | 60-150 |
| Beat adherence, self-reported | Unreliable; clusters in the 90s regardless |
| Beat adherence, GPS-verified | 85% acceptable, 90%+ well run |
| Productive call rate | 60-75% established territory |
| Visit frequency, A / B / C class | Weekly / fortnightly / monthly |
| Beat load target | ~85% of theoretical capacity, not 100% |
| Review cadence | Quarterly beats; annual re-classification |
The Coverage Arithmetic Behind a Beat Plan
Most beat plans fail because nobody reconciled the plan against capacity before publishing it. The calculation takes ten minutes and constrains everything downstream.
Take a pre-sales territory with a verified universe of 1,180 outlets, classified 190 A, 385 B and 605 C, served by two reps working 25 days a month at 35 productive calls a day.
| Class | Outlets | Visits / Month | Calls Required |
|---|---|---|---|
| A | 190 | 4 | 760 |
| B | 385 | 2 | 770 |
| C | 605 | 1 | 605 |
| Total required | 1,180 | — | 2,135 |
| Capacity available | 2 reps | 25 days | 1,750 |
| Shortfall | — | — | 385 calls (22%) |
There are only three honest responses to a shortfall: add a rep, reduce frequency on the C-class tail, or formally remove outlets from the plan and hand them to a wholesaler or sub stockist. Publishing the plan anyway is the fourth option and it is what most territories do. Reps then silently drop the least rewarding calls, and six months later nobody can explain why C-class coverage collapsed.
Classifying Outlets by Value
Classification drives frequency, and getting it wrong is expensive in both directions: under-visiting an A-class counter hands the shelf to a competitor, while over-visiting C-class consumes the days the A-class outlets needed.
| Class | Share of Outlets | Share of Revenue | Visit Frequency | Basis |
|---|---|---|---|---|
| A | 15-20% | 50-60% | Weekly | Monthly offtake potential, not current billing |
| B | 30-35% | 25-35% | Fortnightly | Steady mid-volume counters |
| C | 45-55% | 10-15% | Monthly | Low volume or occasional |
The critical detail is that classification should rest on potential offtake rather than on what the outlet currently buys from you. Classifying on current billing entrenches whatever coverage pattern already exists and guarantees the growth outlets stay under-served.
Beat Planning by Distribution Model
The planning logic is constant; the binding constraint changes.
| Model | Binding Constraint | Outlets / Day | Planning Note |
|---|---|---|---|
| Pre-sales (order today, deliver tomorrow) | Time per call | 30-45 | Delivery route must follow the sales beat at a fixed interval |
| Van sales (sell and deliver together) | Vehicle capacity | 20-35 | Beat size set by load, not by hours |
| Dairy / daily delivery | Time window | 60-150 drops | Same route daily, pre-dawn, no slack |
| Rural / semi-urban | Travel time | 18-25 | Align to weekly market days where they exist |
Measuring Whether the Beat Plan Works
Visit counts alone say nothing. Four numbers read together distinguish three different problems.
| Metric | What It Measures | Healthy Range | What a Low Reading Means |
|---|---|---|---|
| Beat adherence | Planned calls actually made | 85-95% GPS-verified | Reps are self-routing; plan no longer describes reality |
| Productive call rate | Visits producing an order | 60-75% | Wrong outlets in the beat, not weak selling |
| Lines per call | Distinct SKUs per productive call | 2.5-5 | Order-taking rather than range selling |
| Effective coverage (ECO) | Unique outlets billed in the period | 65-80% urban | Outlets dropping out of the cycle unnoticed |
The combination matters more than any single figure. High adherence with a low strike rate means reps went where they were sent and the outlets had no reason to buy, which is a planning failure rather than a selling one. Low adherence with a high strike rate is the more dangerous pattern: the rep is skipping difficult outlets, revenue holds for two or three quarters, and coverage erodes invisibly until it is very hard to recover. Our guides to field sales KPIs and effective coverage of outlets work through the diagnosis.
Rebalancing a Beat Plan That Has Decayed
Most distributors inherit a plan rather than build one, and an unrevised plan typically mis-routes 15-20% of its calls within a year as outlets open, close and change class.
A rebalance is cheaper than a rebuild and runs in a different order. Start with two exception lists: outlets billed in the last three months that are not in the plan, and outlets in the plan that have not billed in three months. Those two lists account for most of the drift, and working them alone recovers a surprising amount of coverage. Then compare planned calls per beat against calls actually completed before the day ended; beats consistently finishing short are overloaded, and the outlets at the end of them are the ones quietly dropping out. Re-cut only the failing beats, because rebuilding every route at once destroys the retailer predictability that makes a permanent plan worth having.
Conclusion
Beat planning is the invisible system that makes Indian FMCG distribution work. It's how brands ensure consistent retailer coverage, scalable field force productivity, and predictable secondary sales. Whether you run a small regional distributor or a national FMCG brand, mastering beat planning, and leveraging modern software to execute it, is essential for growth. Explore our distribution tracking, sales productivity solutions, route optimization, or deep dive into beat planning software.
For the complete picture, see our beat planning guide.
Sources & References
Frequently Asked Questions
Beat planning is the process of designing and assigning daily sales routes (called beats) that field salesmen follow to visit retail outlets in an organized, repeatable manner. It's how FMCG brands ensure consistent retailer coverage across large territories at scale.
A Permanent Journey Plan (PJP) is the master schedule that assigns each beat to specific days of the week. For example: Monday = Beat A, Tuesday = Beat B. A salesman follows the PJP weekly, ensuring every retailer is visited at the required frequency.
A typical beat contains 50-150 outlets, depending on product category and visit frequency. Daily beats (bread, milk) have 80-150 outlets. Weekly beats (personal care, home care) have 50-100. Fortnightly beats have 40-80.
Beat adherence measures the percentage of planned outlets a salesman actually visits on a given day. High adherence (95%+) means the planning system works. Low adherence indicates fake visits, skipped outlets, or planning problems. GPS-based tracking via modern software pushes adherence above 95%.
Beat planning is strategic: deciding which retailers go in which beat, and when each beat is visited. Route optimization is tactical: minimizing travel time within a specific day's beat. Both work together in a complete field sales system.
Yes. Modern beat planning software automatically generates optimal beats based on retailer density, geography, sales potential, and salesman capacity. It also rebalances beats as retailers change, tracks adherence via GPS, and provides analytics on productivity, eliminating most manual effort.
It depends on whether the visit is a sales call or a delivery drop. In pre-sales general trade, where the rep takes an order at the counter, 30-45 productive calls a day is the working band in dense urban markets and 18-25 in rural ones where travel dominates. Daily-delivery beats such as milk and bread carry far more, 60-150 drops, because a drop takes a fraction of the time a sales call does.
Into A, B and C bands by monthly offtake potential rather than current billing. A typical Indian split is 15-20% A-class carrying 50-60% of revenue on weekly visits, 30-35% B-class on fortnightly visits, and 45-55% C-class on monthly visits. Classifying on current billing entrenches existing coverage and leaves growth outlets under-served.
Add a rep, reduce visit frequency on the C-class tail, or formally remove outlets from the plan and serve them through a wholesaler or sub stockist. All three are defensible. Publishing a plan that exceeds capacity is not: reps silently drop the least rewarding calls and coverage collapses without anyone deciding it should.
Quarterly at minimum for beat composition, with value classification reviewed annually against real offtake data. An unrevised plan typically mis-routes 15-20% of its calls within a year as outlets open, close and shift class. Reclassifying more often than annually produces frequency churn that confuses both reps and retailers.
Related SpireStock Features
Related Industries
Related Solutions
Boost field sales team productivity with beat planning, GPS attendance, order capture, and performance analytics. Built for Indian FMCG teams.
Track and manage your retail network. Geo-tag outlets, capture secondary sales, manage beats, and monitor retailer performance. Try SpireStock.
Related Entities
Ready to Streamline Your Distribution?
Start your free 14-day trial and see how SpireStock can transform your dairy, FMCG or consumer-goods distribution operation, from order capture to crate recovery.

SpireStock Team
Distribution Technology Experts
SpireStock Team writes for SpireStock on distribution management, supply-chain optimisation and field operations for Indian dairy and FMCG brands.