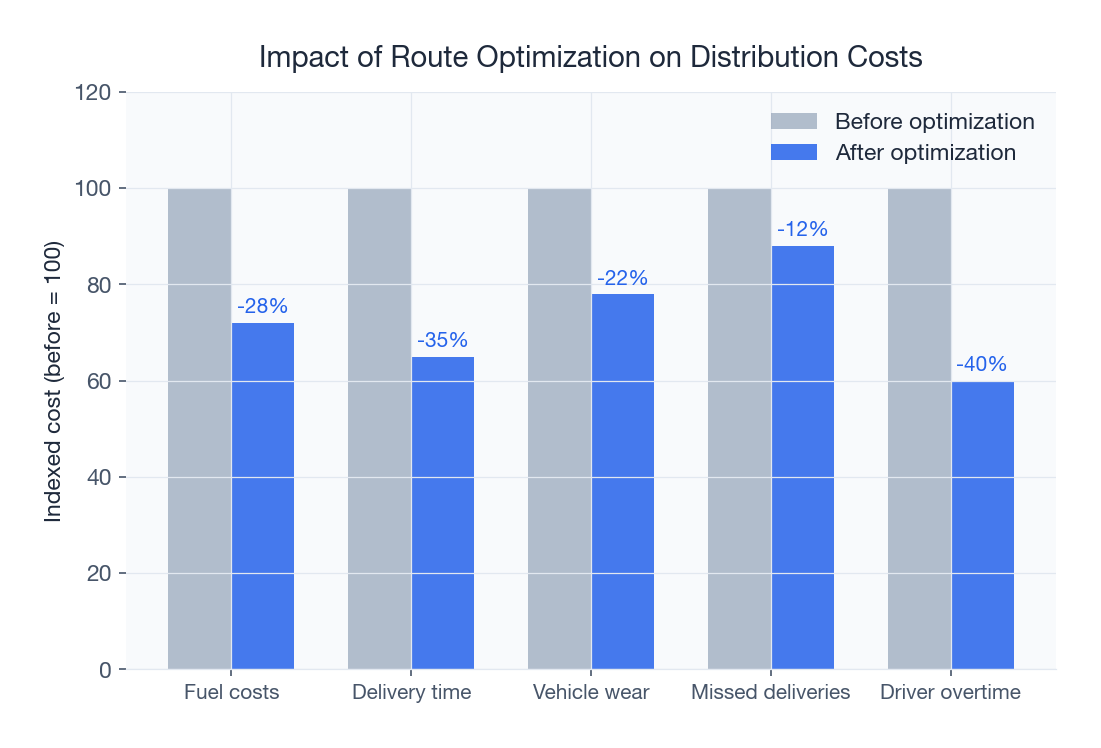
Why Route Optimization Matters for Milk Delivery
Milk delivery is uniquely demanding. Products are perishable, delivery windows are tight (often 4-6 hours in the morning), and routes span dense urban lanes to scattered rural villages. Yet most Indian dairy operations still plan routes manually, relying on driver intuition and historical habit rather than data-driven optimization.
The result? Vehicles travel 20-30% more distance than necessary, burning extra fuel, wearing out faster, and arriving at customers later than they should. For a fleet of even 10 vehicles, this inefficiency translates to Rs 3-5 lakh in unnecessary costs annually. Whether you deliver milk in Mumbai or distribute beverages across Maharashtra, route optimization is the single fastest way to cut delivery costs. Start your free 30-day trial and measure the savings within the first week.
The True Cost of Unoptimized Routes in India
Before exploring solutions, let us quantify the problem. Indian dairy and FMCG distribution fleets face uniquely challenging conditions that amplify route inefficiency:
| Cost Factor | Unoptimized Route | Optimized Route | Annual Savings (10 vehicles) |
|---|---|---|---|
| Daily distance per vehicle | 110-130 km | 80-95 km | Rs 3.5-5 lakh (fuel) |
| Delivery time per route | 6-8 hours | 4.5-6 hours | Rs 1.5-2 lakh (overtime) |
| Vehicle maintenance | Rs 4,500/month/vehicle | Rs 3,200/month/vehicle | Rs 1.5 lakh |
| On-time delivery rate | 72-80% | 92-97% | Reduced complaints and returns |
| Stops per route | 25-30 | 30-40 | Fewer vehicles needed |
Combined, these savings amount to Rs 7-10 lakh per year for a 10-vehicle fleet. For larger operations running 50-100 vehicles across multiple cities, the savings are proportionally larger, often exceeding Rs 50 lakh annually.
How Route Optimization Works for Dairy Distribution
SpireStock's route optimization engine uses intelligent algorithms to calculate the most efficient delivery sequence for each vehicle, considering multiple real-world constraints:
- Delivery time windows, each customer has preferred or mandatory delivery times. A retailer in Andheri may need delivery before 7 AM, while a restaurant in Bandra can accept until 10 AM.
- Vehicle capacity, load limits for weight, volume, and crate count. A Tata Ace carries 750 kg while a Mahindra Bolero handles 1,200 kg, the system optimizes within these constraints.
- Traffic patterns, historical and real-time traffic data for accurate travel time estimates. Peak-hour congestion on arterial roads like Ring Road in Delhi or ORR in Bangalore is factored into timing calculations.
- Priority stops, high-value customers or urgent deliveries are scheduled first
- Driver familiarity, preference for assigning drivers to areas they know well
- Product types, temperature-sensitive products may need different routing than ambient items
- Crate pickup, empty crate returns are integrated into the route plan so drivers collect empties during the same trip
Key Benefits of Optimized Milk Delivery Routes
1. Fuel Cost Reduction (20-30%)
By eliminating unnecessary distance and reducing idle time, optimized routes directly cut fuel consumption. For a 10-vehicle fleet averaging 100 km daily each, a 25% distance reduction saves approximately Rs 4-5 lakh per year in fuel alone. With diesel prices now above Rs 90 per litre in most Indian cities, every unnecessary kilometre is a direct margin hit.
2. Faster Deliveries and Fresher Products
Efficient sequencing means each stop is reached sooner. Combined with real-time distribution tracking, managers can monitor progress and dynamically adjust routes when unexpected delays occur. This ensures dairy products reach customers while still at peak freshness, critical for perishable items with shelf lives measured in hours.
For fresh produce distributors and bakery delivery operations, faster routes mean the difference between selling fresh goods and managing returns of stale inventory.
3. Better Vehicle Utilization
Smart capacity planning ensures each vehicle carries an optimal load, not overloaded (risking product damage) and not underloaded (wasting a trip). This can reduce the total number of required delivery runs by 15-20%. The fleet management solution provides vehicle-level analytics showing utilization rates, idle time, and maintenance needs.
4. Improved Customer Satisfaction
Consistent, on-time deliveries build trust with distributors and retailers. When your delivery reliability exceeds 95%, you become the preferred supplier, a significant competitive advantage in the crowded dairy distribution market. Brands like Amul have built their reputation partly on delivery reliability, and route optimization is how they maintain it at scale.
5. Reduced Carbon Footprint
A 25% reduction in total fleet distance translates directly to a 25% reduction in carbon emissions. For environmentally conscious brands and those reporting ESG metrics, route optimization is one of the simplest and most impactful sustainability initiatives available.
From Static to Dynamic: The Evolution of Route Planning
Traditional route planning creates fixed routes that rarely change. Modern dynamic route optimization adapts to daily realities:
- Variable order volumes, routes adjust based on actual daily orders, not assumptions. Monday orders differ from Saturday orders.
- New customer additions, new delivery points are automatically integrated into the nearest efficient route without disrupting existing sequences
- Vehicle breakdowns, if a vehicle goes down, its stops are redistributed across remaining vehicles in minutes
- Seasonal demand shifts, summer ice cream demand, festive ghee demand, Navratri paneer spikes, and other seasonal patterns are reflected in routing
- Weather conditions, heavy monsoon rains in Kolkata or Chennai may require route adjustments to avoid flooded areas
Route Optimization for Different Distribution Models
Hub-and-Spoke Dairy Distribution
In the classic dairy model, products move from the plant to regional hubs (C&F agents or depots) and then to individual distributors. Route optimization at the hub-to-distributor level has the highest impact, as these routes involve the most stops and the tightest time windows.
Direct-to-Retailer Delivery
Some dairy brands, including Country Delight and newer D2C dairy brands, deliver directly to consumers or retailers. These operations involve hundreds of small-drop stops per route, making optimization even more critical. A 2-minute saving per stop across 40 stops saves over an hour per route per day.
Multi-Category Distribution
Companies distributing dairy alongside beverages and other FMCG items need routes that account for different product handling requirements. Cold chain products may need earlier delivery slots, while ambient products have more flexibility. The optimization engine balances these constraints within a single route.
Implementing Route Optimization: A Practical Guide
Step 1: Map Your Current Routes
Before optimizing, document your existing routes, distances, stop sequences, delivery times, and costs. This establishes a baseline for measuring improvement. Use analytics dashboards to capture this data automatically over 1-2 weeks.
Step 2: Geocode Your Delivery Points
Accurate location data for every delivery point is critical. The SpireStock mobile app captures GPS coordinates during the first few delivery runs, building your location database automatically. For Indian addresses, which are notoriously imprecise, this GPS-based approach is far more reliable than geocoding from text addresses.
Step 3: Define Your Constraints
Document your delivery windows, vehicle capacities, driver availability, and priority rules. The more accurately you define constraints, the better the optimization results.
Step 4: Optimize and Compare
Run the optimizer and compare proposed routes against your current ones. Most companies see a 15-25% improvement in total distance on the very first optimization.
Step 5: Roll Out and Iterate
Start with a pilot cluster of routes. Gather driver feedback, they know ground realities that algorithms might miss. Refine the system based on real-world experience and expand to your full network. Driver buy-in is critical: show them that optimized routes mean less driving, fewer complaints, and earlier finishes.
Measuring Route Optimization ROI
Track these metrics to quantify the impact of route optimization on your distribution operations:
- Cost per delivery, total delivery cost divided by number of stops served (target: below Rs 15)
- On-time delivery rate, percentage of deliveries made within the promised window (target: above 93%)
- Average distance per stop, total distance divided by number of stops (target: below 2.5 km in urban areas)
- Vehicle utilization rate, percentage of vehicle capacity used per trip (target: above 80%)
- Fuel cost per kilometer, helps isolate route efficiency from fuel price changes
- Driver productivity, stops completed per hour of delivery time (target: 6-8 stops/hour)
Want to see the impact on your specific operation? Request a free route analysis from our team. We will map your current routes, run an optimization simulation, and show you exactly how much you could save. Check our pricing to understand costs.
Real-World Implementation Scenarios
The route optimization story is best told through real operational data. Here are three illustrative examples from different geographies and operational sizes.
Case Study 1: Karnataka Fresh Dairy, Bangalore
Karnataka Fresh Dairy operates 38 delivery vehicles across Bangalore, delivering to over 4,200 retail points daily. Modelled on regional champions like Nandini, they were spending Rs 3.4 crore annually on fuel and driver costs. Routes were designed by senior operations staff manually, a Sunday night exercise that took 6 hours and produced only roughly-optimal outputs. After deploying SpireStock's fleet management solution, algorithmic route planning cut total kilometres by 26%, saving Rs 88 lakh in year one. On-time delivery improved from 81% to 95%, and driver overtime dropped by 45%.
Case Study 2: Marathwada Milk Distributors, Pune
Marathwada handles products similar to Amul and operates 22 vehicles across Pune and surrounding districts. Their challenge was mixed urban-rural routes with widely varying delivery windows. AI-driven route optimization accounted for time windows, vehicle capacity, and traffic patterns, saving Rs 42 lakh in fuel and enabling the same fleet to serve 18% more delivery points without adding vehicles.
Case Study 3: Coastal Fresh Foods, Kolkata
Coastal Fresh Foods distributes dairy plus packaged beverages (think Bisleri-style products) across 195 routes in Kolkata. Their pain point was peak-hour traffic that made delivery estimates unreliable. SpireStock's optimization engine, which learns from historical traffic patterns, delivered a 23% reduction in route times and recovered Rs 61 lakh in year one, against software cost of Rs 8 lakh.
Cost & ROI Analysis
Route optimization is arguably the fastest payback module in any distribution technology stack. Here is the typical financial picture for a mid-sized milk delivery operation:
| Fleet Size | Annual Fuel Spend (Before) | Savings (After Optimization) | Software Cost | Net Year-1 Benefit |
|---|---|---|---|---|
| 5-10 vehicles | Rs 35-70 lakh | Rs 9-18 lakh | Rs 2-3 lakh | Rs 7-15 lakh |
| 11-25 vehicles | Rs 75-1.6 crore | Rs 20-42 lakh | Rs 4-6 lakh | Rs 16-36 lakh |
| 26-50 vehicles | Rs 1.6-3.2 crore | Rs 42-85 lakh | Rs 6-9 lakh | Rs 36-76 lakh |
| 50+ vehicles | Rs 3+ crore | Rs 85 lakh+ | Rs 9-14 lakh | Rs 76 lakh+ |
Beyond fuel, route optimization also delivers savings in driver overtime (Rs 3-8 lakh annually), vehicle maintenance (Rs 2-6 lakh), and customer retention from improved service levels. The typical payback period is 6-10 weeks. These benefits translate across categories, dairy, beverages, bakery, fresh produce, and general FMCG. For deeper reading, see our guide to the distributor management software space.
Conclusion: Every Kilometre Counts
In dairy distribution, where margins are thin and competition is fierce, route optimization is not a nice-to-have, it is the most direct path to cost reduction and service improvement. The technology is proven, the ROI is measurable within weeks, and the implementation is non-disruptive. Whether you run 5 vehicles or 500, optimized routes mean lower costs, happier customers, and a healthier bottom line. For more on building efficient distribution operations, read our guides on dairy delivery route planning and milk distribution management systems.
Sources & References
Frequently Asked Questions
Most dairy operations see a 20-30% reduction in delivery costs after implementing route optimization. For a 10-vehicle fleet, this typically translates to Rs 4-8 lakh in annual savings from reduced fuel, maintenance, and overtime costs.
Yes, modern route optimization accounts for Indian traffic patterns, including peak hour congestion, one-way streets, narrow lanes, and restricted vehicle zones. The algorithms use historical traffic data and can adapt to real-time conditions.
Absolutely. Good route optimization combines algorithmic efficiency with driver expertise. Drivers can flag ground realities, like roads under construction or difficult parking, and the system incorporates these inputs into future optimizations.
When a new distributor or retailer is added, the system automatically evaluates which existing route they fit into most efficiently, or recommends creating a new route if existing ones are at capacity.
Not necessarily. Smartphone-based GPS tracking through a mobile app is sufficient for most operations. This is more cost-effective and easier to deploy than dedicated GPS hardware.
Yes, the system supports multiple vehicle types with different capacity constraints, three-wheelers for narrow lanes, mini-trucks for urban distribution, and larger vehicles for trunk routes. Each vehicle type's constraints are factored into route planning.
For dairy distribution with daily orders, routes should be optimized daily based on actual order volumes. Additionally, a comprehensive route structure review should be done quarterly to account for changes in customer base and demand patterns.
You need: delivery point addresses (or GPS coordinates), vehicle details (capacity, type), delivery time windows, and historical order data. Most of this is gathered automatically through the mobile app during normal operations.
Related SpireStock Features
Related Solutions
GPS fleet tracking, driver management, and route optimization for dairy and FMCG delivery vehicles. Reduce fuel costs by 25%. Try SpireStock.
Manage your entire distributor network digitally. Onboarding, credit limits, outstanding tracking, and performance analytics. Start free trial.
Related Entities
Ready to Streamline Your Distribution?
Start your free 30-day trial and see how SpireStock can transform your dairy, FMCG or consumer-goods distribution operation, from order capture to crate recovery.
SpireStock Team
Product & Industry Insights
SpireStock Team leads product at SpireStock, where the team ships distribution management software for India's dairy, FMCG and consumer-goods brands.


