ما هو التسويق التجاري؟
التسويق التجاري هو التسويق الموجه إلى قناة التجارة، والموزعين، وتجار الجملة، وتجار التجزئة، بدلاً من المستهلكين النهائيين. بينما يقنع تسويق المستهلك المتسوق برغبته في منتج، يضمن التسويق التجاري أن هذا المنتج متاح، ومرئي، ومتموضع بشكل جذاب عند نقطة الشراء. التمييز أساسي: تسويق المستهلك يخلق الطلب، والتسويق التجاري يلبيه.
في سياق FMCG الهندي، يشمل التسويق التجاري كل شيء من تصميم العروض وبرامج حوافز تجار التجزئة إلى مفاوضات وضع الرفوف، ونشر مواد نقطة الشراء (POP)، وتنفيذ الترويج داخل المتجر. إنه الآلية التي تحول استراتيجية العلامة التجارية الوطنية إلى واقع تجزئة محلي عبر 12 مليون متجر كيرانا ومنافذ التجارة الحديثة.
لماذا تستثمر العلامات التجارية بكثافة في التسويق التجاري؟ لأن أفضل حملة تلفزيونية في العالم تفشل إذا لم يكن المنتج على الرف عندما يدخل المستهلك إلى المتجر. تنفق شركات FMCG الهندية عادةً 15-25% من إجمالي الإيرادات على التسويق التجاري، وهو رقم يتجاوز غالبًا ميزانية الإعلانات للمستهلكين. بالنسبة لشركة بإيرادات سنوية تبلغ 500 كرور روبية، يُترجم ذلك إلى 75-125 كرور روبية موجهة لتنشيط قناة التجارة كل عام. حجم هذا الاستثمار يجعل جودة التنفيذ ضرورة عالية المخاطر.
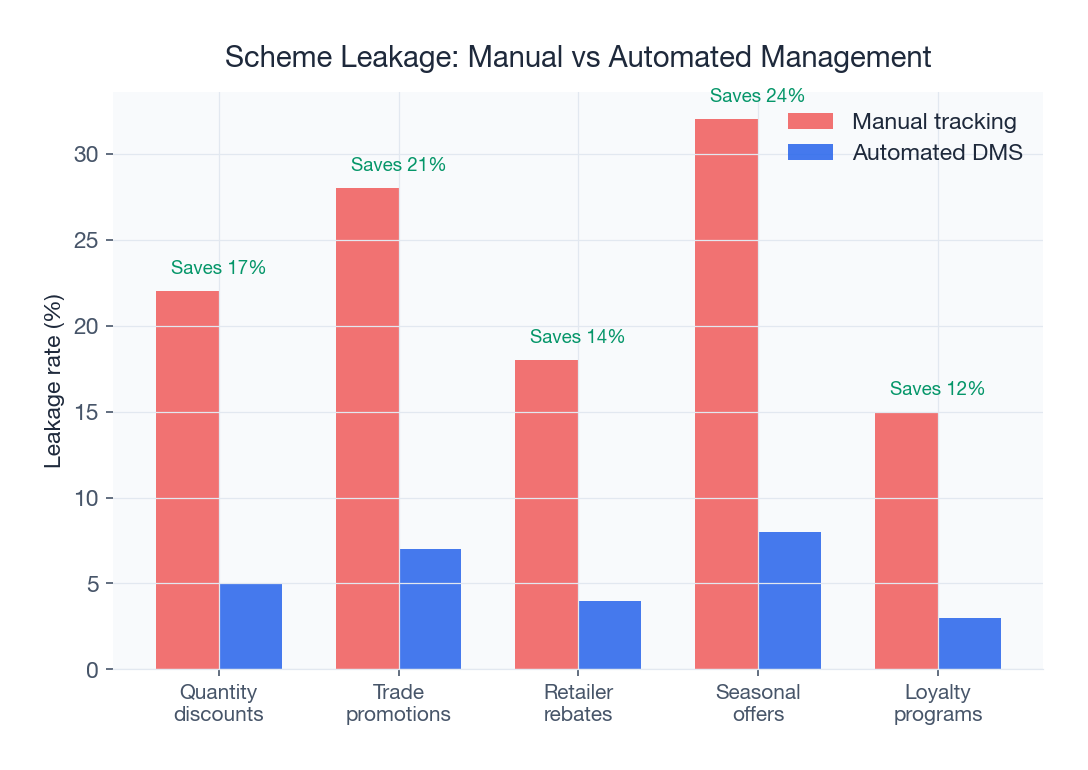
ومع ذلك، على الرغم من أهميته، يظل التسويق التجاري واحدًا من أقل المجالات وضوحًا وأسوأها قياسًا في عمليات FMCG. تصمم فرق العلامة التجارية العروض في قاعات اجتماعات مكيفة. يتلقى الموزعون التعميمات. يتم إحاطة مندوبي المبيعات. من المفترض أن يستفيد تجار التجزئة. لكن بين الاستراتيجية والرف، توجد فجوة تنفيذ شاسعة تكلف صناعة FMCG الهندية ما يقدر بـ 25,000-30,000 كرور روبية سنويًا في الإنفاق التجاري المهدر. فهم هذه الفجوة هو الخطوة الأولى نحو إغلاقها. للحصول على نظرة أعمق على كيفية تآكل تسرب العروض لميزانيات التجارة، اقرأ دليلنا حول منع تسرب العروض في توزيع FMCG.
التسويق التجاري مقابل تسويق المستهلك
تشغل شركات FMCG محركين تسويقيين متوازيين. تسويق المستهلك يتحدث إلى المتسوقين. التسويق التجاري يتحدث إلى شركاء القناة. كلاهما ضروري، لكنهما يختلفان في الجمهور والقنوات والمقاييس والميزانيات وأساليب القياس. فهم هذه الاختلافات أمر بالغ الأهمية للموزعين الذين يقعون في تقاطع كليهما.
| البعد | تسويق المستهلك | التسويق التجاري |
|---|---|---|
| الجمهور المستهدف | المستهلكون النهائيون، المتسوقون | الموزعون، تجار الجملة، تجار التجزئة |
| القنوات الأساسية | التلفزيون، الرقمية، المطبوعة، الخارجية | العروض التجارية، مواد POP، العروض داخل المتجر، لقاءات تجار التجزئة |
| المقاييس الرئيسية | الوعي بالعلامة التجارية، الاعتبار، حصة السوق | التوزيع العددي، التوزيع المرجح، حصة الرف، ROI للعرض |
| قياس ROI | دراسات تتبع العلامة التجارية، نمذجة ارتفاع المبيعات | الحجم التزايدي، التكلفة لكل حالة تزايدية، معدل تنشيط تجار التجزئة |
| التوقيت | قائم على الحملة (رحلات 4-8 أسابيع) | مستمر مع ذروات موسمية (المهرجانات، الصيف، العودة إلى المدارس) |
| تخصيص الميزانية | 8-15% من الإيرادات (ATL + الرقمية) | 15-25% من الإيرادات (الإنفاق التجاري + الترويج) |
| صانع القرار | مدير العلامة التجارية، CMO | مدير التسويق التجاري، رئيس المبيعات، الموزع |
| حلقة التغذية الراجعة | بطيئة (أسابيع إلى أشهر عبر الأبحاث) | سريعة (بيانات المبيعات الثانوية اليومية) |
الرؤية الحاسمة للموزعين: تسويق المستهلك يخلق الجذب. التسويق التجاري يخلق الدفع. عندما يكون كلا المحركين متوافقين، تطير المنتجات من الرفوف. عندما يكونان غير متوافقين، يظل طلب المستهلك غير ملبى لأن المنتج غير متوفر، أو غير مرئي، أو مرتفع السعر عند نقطة الشراء. قد تنفق العلامة التجارية 50 كرور روبية على حملة تلفزيونية لمتغير بسكويت جديد، ولكن إذا فشل تنفيذ التسويق التجاري، أي أن المنتج لديه توزيع تجزئة ضعيف، ولا توجد وضوح للرف، ولا حافز لتاجر التجزئة لتخزينه، فإن استثمار المستهلك بأكمله يُهدر.
هذا هو السبب في أن شركات FMCG المتطورة تنظر إلى التسويق التجاري ليس كفكرة لاحقة لتسويق المستهلك بل كتوأم تشغيلي له. يجب أن يعمل الاثنان معًا بشكل متزامن، مع توقيت حملة المستهلك متزامن مع طرح العروض التجارية، ونشر مواد POP، وحملات توزيع التجزئة. الموزعون الذين يفهمون هذا التزامن يصبحون شركاء أكثر قيمة بكثير للعلامات التجارية. للفهم الأساسي لكيفية ارتباط المبيعات الأولية والثانوية بالتنفيذ التجاري، راجع دليلنا حول المبيعات الأولية مقابل الثانوية في FMCG الهندي.
دور الموزع في تنفيذ التسويق التجاري
في سلسلة قيمة FMCG الهندية، تصمم العلامات التجارية استراتيجيات التسويق التجاري. وينفذها الموزعون. يخلق هذا التقسيم للمسؤولية تحديًا هيكليًا: الأشخاص الذين يصممون العروض منفصلون عن الأشخاص الذين ينفذونها بطبقات تنظيمية متعددة، ومسافات جغرافية، وعدم تناسق في المعلومات.
إليك ما يعنيه التنفيذ فعليًا على مستوى الموزع:
- توصيل العرض. يجب على فريق مبيعات الموزع فهم كل عرض تجاري نشط، ومعايير الأهلية، وهيكل الفائدة، وفترة الصلاحية، والمنافذ المستهدفة، وإيصاله بدقة إلى تجار التجزئة أثناء تغطية الـ beat اليومية. مندوب المبيعات الذي لا يفهم العرض لا يستطيع بيعه. مندوب المبيعات الذي يفهمه بشكل غير صحيح يخلق نزاعات.
- وضع الرف والوضوح. تدفع العلامات التجارية مقابل مواضع الرف المتميزة. يتفاوض الموزعون مع تجار التجزئة ويضمنون الامتثال. يشمل ذلك وضع المنتجات على مستوى العين، وتأمين مواضع نهاية الجناح، وضمان أعداد المواجهة الدنيا. بدون التنفيذ على المستوى الميداني، تظل اتفاقيات الرف وعودًا ورقية.
- نشر مواد POP. يتم تصميم مواد نقطة الشراء، ومتحدثو الرفوف، والمعلقات، والملصقات، وعروض العداد، والحوامل، من قبل فرق العلامة التجارية وشحنها إلى الموزعين بالجملة. يجب على القوة الميدانية للموزع نشر هذه المواد في المنافذ المستهدفة، والتحقق من الوضع، واستبدال المواد التالفة أو منتهية الصلاحية. تشير بيانات الصناعة إلى أن 30-40% من مواد POP المشحونة إلى الموزعين لا تصل أبدًا إلى رفوف التجزئة.
- إعداد العرض والترويج. خلال الفترات الترويجية، تمول العلامات التجارية عروضًا خاصة: مكدسات الأرضية، وعروض الجزيرة، ومواضع عداد الدفع. ينسق الموزعون مع تجار التجزئة لإعداد هذه العروض، والحفاظ عليها طوال فترة الترويج، وتفكيكها بعد ذلك. تختلف جودة التنفيذ بشكل كبير عبر المناطق وتجار التجزئة.
- تطبيق العرض أثناء إصدار الفواتير. يجب تطبيق العروض التجارية بدقة أثناء إنشاء الفاتورة. الخصومات الثابتة، والحوافز القائمة على الشرائح، ومجموعات المنتجات، والفوائد الخاصة بفئة تاجر التجزئة، كلها بحاجة إلى التدفق من خلال عملية إصدار الفواتير دون أخطاء يدوية. هنا يصبح محرك إدارة العروض لا غنى عنه.
فجوة التنفيذ بين نية العلامة التجارية وواقع التجزئة ليست مجرد مضايقة تشغيلية بسيطة. إنها أكبر مصدر منفرد لإهدار التسويق التجاري في FMCG الهندي. عندما يتعثر التنفيذ، تفرط العلامات التجارية في الإنفاق على عروض لا تصل إلى جمهورها المستهدف، ويفقد تجار التجزئة الثقة في القناة، ويتحمل الموزعون اللوم على نتائج لم يكونوا مجهزين لتقديمها. يعالج حل إدارة العروض القوي ذلك من خلال رقمنة توصيل العرض وتطبيقه وتتبعه عبر سلسلة التوزيع.
الركائز الخمس للتسويق التجاري
يستند التسويق التجاري الفعال في FMCG الهندي على خمس ركائز مترابطة. تعالج كل ركيزة جانبًا محددًا من تنشيط القناة، والضعف في أي منها يقوض الآخرين. الموزعون الذين يتفوقون في الخمسة جميعها يصبحون شركاء لا غنى عنهم للعلامات التجارية ويبنون مزايا تنافسية مستدامة في مناطقهم.
الركيزة 1: التسعير والهوامش
يبدأ التسويق التجاري بهيكل الهامش. يخزن تجار التجزئة ويدفعون المنتجات التي تقدم هوامش جذابة. دور الموزع هو ضمان توصيل بنية الهامش، MRP، وهامش تاجر التجزئة، وهامش الموزع، وفوائد العرض، بشفافية وتطبيقها باستمرار. في FMCG الهندية، تتراوح هوامش تاجر التجزئة عادةً من 8-15% على السلع الأساسية، 15-25% على الأطعمة المعبأة، و25-40% على منتجات العناية الشخصية. عندما تتداخل عروض متعددة، يمكن أن يتغير الهامش الفعال يوميًا، مما يخلق ارتباكًا في عداد التجزئة إذا لم تتم إدارته بشكل منهجي.
اتساق التسعير عبر المنطقة أمر ضروري. إذا اكتشف أحد تجار التجزئة أن منفذ منافس يحصل على سعر فعال أفضل لنفس المنتج، تتآكل الثقة بسرعة. يضمن محرك العروض المدعوم من DMS أن قواعد التسعير والخصومات وفوائد العروض يتم تطبيقها بشكل موحد عبر جميع الفواتير، مما يلغي عدم الاتساق الذي يصيب الفوترة اليدوية.
الركيزة 2: الترويج والعرض
الترويج هو فن جعل المنتجات مرئية ومتاحة عند نقطة الشراء. في تجزئة الهند، حيث 95% من المنافذ هي متاجر كيرانا صغيرة الحجم بمساحة رفوف محدودة، يحدد تنفيذ الترويج ما إذا كان المنتج سيلاحظ أو يدفن خلف المنافسين. تشمل مقاييس الترويج الرئيسية حصة الرف (النسبة المئوية لإجمالي مساحة الرف التي تشغلها علامة تجارية ضمن فئتها)، والامتثال للـ planogram (ما إذا كانت المنتجات موضوعة وفقًا للتخطيط المتفق عليه)، وجودة العرض (النظافة، وعلامات التسعير، وعدد المواجهة).
بالنسبة لمنافذ التجارة الحديثة، يمكن قياس الامتثال للـ planogram بشكل منهجي باستخدام تطبيقات القوة الميدانية مع التقاط الصور. للتجارة العامة، يتم تقييم حصة الرف عادةً من خلال عمليات تدقيق دورية من قبل فريق المبيعات. تستفيد كلتا القناتين من التقاط الصور وإعداد التقارير المستند إلى تطبيق الهاتف المحمول الذي توفره منصات DMS الحديثة.
الركيزة 3: العروض والترويج التجاري
العروض التجارية هي عملة إدارة قناة FMCG في الهند. تأتي في أشكال متعددة: خصومات ثابتة على مشتريات الحالات، وحوافز قائمة على الشرائح تكافئ الحجم، وعروض ترويجية موسمية مرتبطة بالمهرجانات أو الطقس، وبرامج ولاء تجار التجزئة التي تكافئ السحب المستمر. قد تدير شركة FMCG واحدة من 15-30 عرضًا نشطًا في وقت واحد عبر فئات منتجات مختلفة، وفئات تجار التجزئة، والمناطق.
تعقيد إدارة هذه العروض يدويًا مذهل. لكل عرض معايير أهلية (نوع المنفذ، المنطقة، الحد الأدنى للطلب)، وحسابات الفوائد (مبلغ ثابت، نسبة مئوية، سلع مجانية)، وفترات الصلاحية، وحدود الميزانية. عندما يزور مندوب مبيعات تاجر تجزئة، يجب أن يعرف العروض التي تنطبق على هذا المنفذ المحدد ويوصل الفائدة بدقة. أي خطأ، سواء كان تطبيق العرض الخطأ، أو حساب الفائدة بشكل خاطئ، أو الفشل في توصيل عرض متاح، يُترجم مباشرة إلى تسرب في الإيرادات أو عدم رضا تاجر التجزئة.
الركيزة 4: إدارة علاقات تجار التجزئة
التسويق التجاري يدور بشكل أساسي حول العلاقات مع تجار التجزئة. فريق مبيعات الموزع هو الواجهة البشرية بين العلامة التجارية وتاجر التجزئة. تُترجم العلاقات القوية إلى مساحة رف أفضل، واعتماد أسرع للعروض، ومعاملة تفضيلية أثناء نقص الإمداد. العلاقات الضعيفة تعني أن منتجاتك تُلقى إلى الرفوف السفلية وأن عروضك لا يتم توصيلها.
إدارة علاقات تجار التجزئة على نطاق واسع تتطلب بيانات. أي تجار التجزئة ينمون؟ أيهم يتراجعون؟ من لم يطلب منذ 14 يومًا؟ من يدفع باستمرار متأخرًا؟ من يخزن منتجات المنافسين ولكن ليس منتجاتك؟ يوفر نظام تتبع تجار التجزئة هذه الإجابات، مما يمكن فريق المبيعات من تحديد أولويات الزيارات، وتخصيص المحادثات، وتحديد الحسابات المعرضة للخطر قبل أن ينشقوا إلى المنافسين.
الركيزة 5: البيانات والتحليلات
الركيزة الخامسة تربط الأربعة الأخرى معًا. بدون بيانات، التسويق التجاري عبارة عن سلسلة من الافتراضات. بالبيانات، يصبح استثمارًا قابلًا للقياس والتحسين. تدفقات البيانات الحاسمة للتسويق التجاري هي المبيعات الثانوية (ما يشتريه تجار التجزئة من الموزعين)، واسترداد العرض (أي العروض يتم استخدامها ومن قبل من)، وتغطية المنافذ (أي تجار التجزئة يتم زيارتهم وكم مرة)، ومعلومات السوق (أسعار المنافسين، والعروض الترويجية، والتوزيع).
منصات تحليلات المبيعات تجمع تدفقات البيانات هذه في لوحات معلومات تكشف عن أداء التسويق التجاري على مستوى المنطقة، والـ beat، والمنفذ، وSKU. عندما تسأل العلامة التجارية "كيف يعمل العرض X في شمال غوجارات؟"، يمكن للموزع الذي لديه تحليلات مدعومة بـ DMS الإجابة بدقة. الموزع الذي يعتمد على Excel والذاكرة لا يستطيع.
تنفيذ العروض على مستوى التجزئة
تُصمم العروض التجارية في المقر الرئيسي للعلامة التجارية. تنتقل عبر فرق المبيعات الإقليمية إلى الموزعين إلى مندوبي المبيعات إلى تجار التجزئة. في كل مرحلة من هذه الرحلة، تتدهور المعلومات. بحلول الوقت الذي يصل فيه العرض إلى عداد التجزئة، يكون قد تمت تصفيته عبر 4-5 طبقات من التواصل، وانخفاض احتمالية التنفيذ الدقيق بشكل كبير.
إليك كيف يفشل تنفيذ العرض عادةً في توزيع FMCG الهندي:
نقطة الفشل 1: مندوب المبيعات لا يوصل العرض
مندوب مبيعات يغطي 25-30 منفذًا يوميًا، ويوازن 15-20 عرضًا نشطًا عبر 50+ SKU، ببساطة لا يمكنه تذكر وتوصيل كل عرض معمول به لكل تاجر تجزئة. تشير تقديرات الصناعة إلى أن مندوبي المبيعات يفشلون في توصيل 25-40% من العروض المتاحة خلال زيارات التجزئة. العروض التي يوصلونها تميل إلى أن تكون تلك التي يفهمونها بشكل أفضل، وليس بالضرورة الأكثر أهمية لتاجر التجزئة.
نقطة الفشل 2: تاجر التجزئة لا يفهم العرض
حتى عند توصيلها، يمكن أن تكون آليات العرض مربكة. "اشترِ 10 حالات من المنتج X، احصل على 1 حالة مجانًا، صالحة على SKUs فوق 200 جرام، باستثناء الحزم الاقتصادية، الحد الأدنى لقيمة الطلب 5,000 روبية، تطبق فقط على الفوترة النقدية" ليست رسالة يستوعبها صاحب متجر كيرانا مشغول خلال مكالمة مبيعات لمدة 3 دقائق. تجار التجزئة الذين لا يفهمون العرض إما يتجاهلونه أو يسيئون تفسير الفائدة، مما يؤدي إلى نزاعات أثناء إصدار الفواتير.
نقطة الفشل 3: العرض يتم تطبيقه بشكل غير صحيح
تطبيق العرض اليدوي أثناء إصدار الفواتير معرض للخطأ بطبيعته. كاتب فوترة يحسب الحوافز القائمة على الشرائح عبر 15 بندًا، مع عروض متداخلة وقواعد خاصة بالفئة، سيرتكب أخطاء. يُظهر تحليلنا لبيانات الفوترة قبل DMS عبر موزعي FMCG الهنود معدلات أخطاء تطبيق العروض من 12-18%، مما يعني أن حوالي واحد من كل سبع فواتير لديه حساب عرض غير صحيح. تتدفق هذه الأخطاء في كلا الاتجاهين: يتلقى بعض تجار التجزئة فائدة أكثر مما ينبغي (تسرب الإيرادات إلى العلامة التجارية)، بينما يتلقى آخرون أقل (تآكل الثقة في القناة).
كيف يضمن DMS دقة العرض
يعالج نظام إدارة التوزيع مع محرك عروض مدمج جميع نقاط الفشل الثلاث. أولاً، يتم دفع تفاصيل العرض إلى تطبيق الهاتف المحمول لمندوب المبيعات تلقائيًا، مع حساب قابلية تطبيق العرض الخاصة بالمنفذ قبل كل زيارة. يرى مندوب المبيعات بالضبط أي العروض تنطبق على كل تاجر تجزئة، مما يلغي عبء الذاكرة. ثانيًا، يتم عرض فوائد العرض بلغة واضحة وبسيطة على التطبيق، مما يسمح لمندوب المبيعات بإظهار تاجر التجزئة الفائدة الدقيقة التي سيحصل عليها. ثالثًا، يتم أتمتة حسابات العرض أثناء إصدار الفواتير، مما يضمن دقة 100% بغض النظر عن التعقيد. يتعامل النظام مع حسابات الشرائح، وعروض المجموعات، وقواعد التراص، وحدود الميزانية دون تدخل بشري.
التأثير قابل للقياس. الموزعون الذين ينتقلون من تنفيذ العروض اليدوي إلى المدفوع بـ DMS يبلغون باستمرار عن معدل توصيل عروض بنسبة 95-100% (ارتفاعًا من 60-75%)، وأخطاء فوترة شبه معدومة على حسابات العروض (انخفاضًا من 12-18%)، وتحسن بنسبة 15-25% في معدلات استرداد العروض حيث يصبح تجار التجزئة على دراية بالعروض المقدمة ويثقون بها.
وضوح التجزئة والترويج
في FMCG، عبارة "بعيد عن العين، بعيد عن العقل" ليست كليشيهًا. إنها واقع تجاري قابل للقياس. المنتجات المرئية على مستوى العين تباع 35-40% أكثر من نفس المنتجات الموضوعة على الرفوف السفلية. المنتجات مع دعم مواد POP تتجاوز المنتجات غير المدعومة بنسبة 15-25%. عروض نهاية الجناح تولد 2-3x سرعة المبيعات لمواضع الرف العادية. هذه ليست أرقامًا نظرية. يتم التحقق منها باستمرار عبر منافذ التجارة الحديثة الهندية من قبل شركات أبحاث الفئات.
الامتثال للـ Planogram
الـ planogram هو مخطط بصري يحدد أين يجب وضع المنتجات على رفوف التجزئة. تستثمر العلامات التجارية جهدًا كبيرًا في تصميم planograms مثلى استنادًا إلى مبادئ إدارة الفئة، وبيانات سلوك المتسوقين، والتموضع التنافسي. لكن الـ planogram جيد فقط بقدر تنفيذه. في التجارة الحديثة الهندية، تتراوح معدلات الامتثال للـ planogram عادةً من 50-70%، مما يعني أن ثلث إلى نصف جميع مواضع المنتجات المخططة لا يتم تنفيذها كما هو مصمم. في التجارة العامة، الـ planograms الرسمية نادرة، لكن اتفاقيات حصة الرف مع تجار التجزئة تخدم وظيفة مماثلة.
حصة الرف
تقيس حصة الرف النسبة المئوية لإجمالي مساحة الرف المتاحة ضمن فئة تشغلها علامة تجارية. لعلامة بسكويت في متجر كيرانا مع 3 أقدام من مساحة رف البسكويت، فإن وجود 12 بوصة تشغلها منتجاتك يمنحك 33% من حصة الرف. يرتبط هذا المقياس مباشرة بالمبيعات. زيادة حصة الرف بمقدار 10 نقاط مئوية تقدم عادةً ارتفاعًا في المبيعات بنسبة 5-8% في المنفذ.
نشر مواد POP
مواد نقطة الشراء هي مندوبو المبيعات الصامتون للتسويق التجاري. متحدث رف موضوع بشكل جيد مع عرض ترويجي يزيد الوعي بالعرض عند عداد التجزئة دون الحاجة إلى حضور مندوب المبيعات. عرض عداد مع علامة تجارية يشغل عقارات بصرية متميزة. ومع ذلك، يبلغ معدل نشر مواد POP في FMCG الهندية فقط 55-65% من المواد المشحونة. تبقى الـ 35-45% المتبقية في مستودعات الموزعين، أو تتلف أثناء النقل، أو يتم التخلص منها من قبل تجار التجزئة الذين لم يتم إحاطتهم بأهميتها.
تتبع القوة الميدانية للامتثال للترويج
تعالج منصات DMS الحديثة تحديات الترويج من خلال تتبع القوة الميدانية مع التقاط الصور. خلال كل زيارة تجزئة، يصور مندوب المبيعات حالات الرفوف، ونشر POP، وإعدادات العرض. هذه الصور موسومة جغرافيًا، ومختومة بالوقت، ويتم تحميلها إلى لوحة معلومات مركزية حيث يمكن لمديري المنطقة مراجعة الامتثال للترويج عبر منطقتهم دون زيارة كل منفذ فعليًا.
تتضمن الأنظمة المتقدمة التعرف على الصور لاكتشاف المنتجات تلقائيًا على الرفوف، وحساب حصة الرف، وإبلاغ انحرافات الـ planogram. في حين أن تدقيق الرفوف المدعوم بـ AI لا يزال ناشئًا في قناة التجارة العامة في الهند، فإنه قياسي بالفعل في عمليات التجارة الحديثة لشركات FMCG الكبرى. المسار واضح: سيتم استبدال عمليات تدقيق الترويج اليدوية بالتحقق الآلي المستند إلى الصور خلال السنوات 3-5 المقبلة عبر كلتا القناتين.
التسويق التجاري المدفوع بالبيانات
أكبر ميزة تنافسية في التسويق التجاري ليست ميزانيات أكبر. إنها بيانات أفضل. العلامة التجارية التي تنفق 50 كرور روبية على التسويق التجاري ببيانات دقيقة حول ما يعمل وما لا يعمل ستتفوق على علامة تجارية تنفق 75 كرور روبية بدون إطار قياس. تحول البيانات التسويق التجاري من بند مصاريف إلى محفظة استثمارية، حيث يتم قياس كل عرض وعرض وترويج مقابل عائده.
استخدام بيانات المبيعات الثانوية لقياس تأثير العرض
بيانات المبيعات الثانوية، سجل ما يبيعه الموزعون لتجار التجزئة، هي المصدر الأكثر أهمية للبيانات لقياس التسويق التجاري. عند إطلاق عرض، تكشف بيانات المبيعات الثانوية عن تأثيره على مستوى المنطقة والـ beat والمنفذ في غضون أيام، وليس الأسابيع أو الأشهر التي تتطلبها أبحاث السوق التقليدية. منصة تحليلات المبيعات المجهزة بشكل جيد تعرض اتجاهات المبيعات الثانوية اليومية متراكبة على جداول زمنية للعرض، مما يجعل من الواضح على الفور ما إذا كان العرض يدفع الحجم التزايدي أم يدعم ببساطة الطلب الموجود.
التمييز الحاسم هو بين الحجم التزايدي والأساسي. الحجم الأساسي هو ما كان سيتم بيعه بدون العرض. الحجم التزايدي هو المبيعات الإضافية الناتجة بسبب العرض. إذا طلب تاجر تجزئة 10 حالات في الأسبوع بدون عرض و12 حالة في الأسبوع مع عرض، فإن الحجم التزايدي هو 2 حالات. يتم حساب ROI للعرض مقابل هذه 2 حالات تزايدية، وليس مقابل الـ 12 الكاملة. الموزعون مع تتبع التوزيع وبيانات المبيعات الثانوية يمكنهم إجراء هذا الحساب. الموزعون بدونه لا يستطيعون التمييز بين الطلب التزايدي والأساسي، مما يؤدي إلى الإفراط في الإنفاق على عروض لا تدفع النمو حقًا.
تحليل ROI على مستوى المنطقة
نفس العرض يؤدي بشكل مختلف عبر المناطق. قد يولد حافز حجم قائم على الشرائح حجمًا تزايديًا بنسبة 25% في أحمد آباد، و8% في سورات، وROI سلبيًا في راجكوت. يكشف التحليل على مستوى المنطقة عن هذه الاختلافات، مما يمكن العلامة التجارية من مضاعفة الجهود في المناطق ذات الأداء العالي وإعادة تصميم أو سحب العروض في المناطق ذات الأداء المنخفض. بدون بيانات دقيقة، تطبق العلامات التجارية نهج مقاس واحد يناسب الجميع، حيث تفرط في الإنفاق في المناطق التي لا تحتاج فيها إلى عروض ولا تنفق بما يكفي حيث يمكن أن تدفع نموًا كبيرًا.
يتطلب تحليل ROI على مستوى المنطقة ثلاثة مدخلات بيانات: تكلفة العرض (إجمالي الإنفاق التجاري المخصص للمنطقة)، والحجم التزايدي (حالات إضافية تم بيعها خلال فترة العرض مقارنة بخط أساس قبل العرض)، والهامش لكل حالة تزايدية. الصيغة مباشرة: ROI = (الحجم التزايدي x الهامش لكل حالة - تكلفة العرض) / تكلفة العرض. الموزعون الذين يزودون العلامات التجارية بهذه البيانات يصبحون شركاء استراتيجيين بدلاً من قنوات تنفيذ.
اختبار A/B لمتغيرات العرض عبر المناطق
التسويق التجاري المدفوع بالبيانات يمكّن من التجريب. بدلاً من طرح تصميم عرض واحد على المستوى الوطني، يمكن للعلامات التجارية اختبار المتغيرات عبر مناطق قابلة للمقارنة. على سبيل المثال، اختبار عرض خصم ثابت في المنطقة A مقابل حافز قائم على الشرائح في المنطقة B، مع المنطقة C كمجموعة تحكم بدون عرض، يكشف عن أي آلية تدفع أفضل ROI لفئة منتج معينة وقناة تجارية. يتطلب نهج اختبار A/B هذا، القياسي في التسويق الرقمي ولكن لا يزال نادرًا في التسويق التجاري، البنية التحتية لبيانات المبيعات الثانوية التي يوفرها DMS.
الموزعون الذين يمكّنون هذا التجريب من خلال توفير بيانات مبيعات ثانوية دقيقة وفي الوقت المناسب على مستوى المنطقة يصبحون لا غنى عنهم لفرق العلامة التجارية. ينتقلون من كونهم أذرع تنفيذ إلى كونهم شركاء بيانات يؤثرون على تصميم العرض، وتخصيص الميزانية، واستراتيجية المنطقة. للفهم الشامل لكيفية ارتباط بيانات المبيعات الثانوية بقرارات الأعمال، اقرأ غوصنا العميق حول المبيعات الأولية مقابل الثانوية في FMCG الهندي.
التسويق التجاري المُمكَّن بالتكنولوجيا
التكنولوجيا لا تحل محل أساسيات التسويق التجاري. لا يزال تجار التجزئة يشترون من أشخاص يثقون بهم، ولا تزال المنتجات بحاجة إلى أن تكون مرئية على الرفوف، ولا تزال العروض بحاجة إلى تقديم قيمة حقيقية. ما تفعله التكنولوجيا هو ضغط الجداول الزمنية للتنفيذ، والقضاء على الأخطاء اليدوية، وتوفير دقة القياس، وتوسيع الممارسات الجيدة عبر الجغرافيا. أربع قدرات تكنولوجية تحول تنفيذ التسويق التجاري لموزعي FMCG الهنود.
محرك عروض DMS
نظام إدارة التوزيع مع محرك عروض متكامل هو التكنولوجيا التأسيسية لتنفيذ التسويق التجاري. يسمح محرك العروض للعلامات التجارية والموزعين بتكوين أي نوع عرض، خصم ثابت، قائم على الشرائح، مجموعة، اشترِ واحدًا واحصل على واحد، خاص بفئة تاجر تجزئة، خاص بالمنطقة، وأن يتم تطبيقه تلقائيًا أثناء إصدار الفواتير. يحدث التكوين مرة واحدة عند الإعداد. يحدث التنفيذ تلقائيًا على كل فاتورة، مما يلغي أخطاء الحساب اليدوي التي تصيب الفوترة المعتمدة على الورق أو جداول البيانات.
يفرض محرك العروض أيضًا قواعد العمل: حدود الميزانية (إيقاف تطبيق عرض عند استنفاد ميزانيته المخصصة)، والحصرية المتبادلة (منع عرضين غير متوافقين من التراص على نفس الفاتورة)، ونوافذ الصلاحية (التفعيل التلقائي والإلغاء التلقائي للعروض في تواريخ محددة). هذه الحواجز تمنع الإفراط في الإنفاق وسوء التطبيق المستوطن في إدارة العروض اليدوية.
SFA للقوة الميدانية (أتمتة قوة المبيعات)
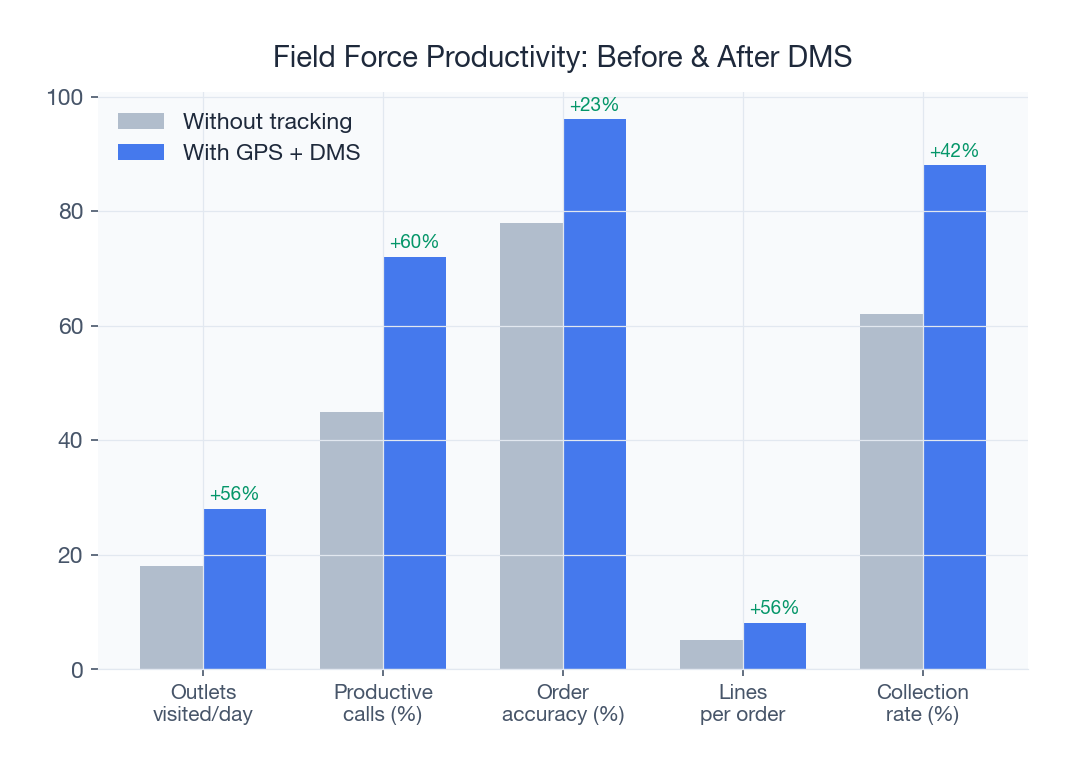
تحول أتمتة قوة المبيعات عبر تطبيق الهاتف المحمول كيفية تنفيذ مندوبي المبيعات للتسويق التجاري في الميدان. يوفر تطبيق SFA رؤية العروض الخاصة بالمنفذ (أي العروض تنطبق على هذا التاجر)، ومعلومات المخزون في الوقت الفعلي (أي المنتجات يمكن لمندوب المبيعات تقديمها الآن)، وتاريخ الطلبات (ما الذي اشتراه هذا التاجر في المرة الأخيرة)، وحالة الدفع (الفواتير المعلقة للتحصيل). هذه المعلومات، التي يتم تقديمها عند نقطة البيع، تمكن مندوب المبيعات من إجراء محادثات مستنيرة ومثمرة مع تجار التجزئة بدلاً من الاعتماد على الذاكرة والقوائم الورقية.
بالنسبة للتسويق التجاري على وجه التحديد، يعمل تطبيق SFA كقناة لتوصيل العروض. عندما يبدأ عرض جديد، يظهر على تطبيق مندوب المبيعات على الفور، مع التفاصيل ومعايير الأهلية وحسابات الفوائد المحملة مسبقًا. يمكن لمندوب المبيعات أن يُظهر لتاجر التجزئة بالضبط ما سيكسبه من خلال زيادة طلبه، مما يحول تعميم العرض المجرد إلى بيان فائدة ملموس ومخصص. للحصول على نظرة أعمق على كيفية تعزيز برنامج تخطيط الـ beat لإنتاجية القوة الميدانية، راجع دليلنا المخصص.
التعرف على الصور لتدقيق الرفوف
تقنية التعرف على الصور الناشئة تقوم بأتمتة الجانب الأكثر كثافة في العمالة من قياس التسويق التجاري: تدقيق الرفوف. بدلاً من حساب المواجهات يدويًا وتقدير حصة الرف، يصور مندوب المبيعات الرف وتحدد خوارزميات AI المنتجات، وتحسب المواجهات، وتكشف عن وجود مواد POP، وتحسب مقاييس حصة الرف. في حين أنها لا تزال ناضجة لبيئة التجارة العامة المتنوعة في الهند، حيث تكون تخطيطات الرفوف غير قياسية وتختلف ظروف الإضاءة، فإن التعرف على الصور يقدم بالفعل نتائج موثوقة في قنوات التجارة الحديثة.
الجمع بين تتبع الحضور المتحقق منه عبر GPS، وعمليات تدقيق الرفوف المعتمدة على الصور، وتقييم الامتثال الآلي للترويج يخلق نظامًا حلقيًا مغلقًا حيث يمكن للعلامات التجارية تحديد معايير الترويج، ويمكن للموزعين تنفيذها، ويمكن لكلا الطرفين التحقق من الامتثال دون الاعتماد على البيانات المبلغ عنها ذاتيًا.
لوحات معلومات إعداد التقارير في الوقت الفعلي
قطعة التكنولوجيا النهائية هي إعداد التقارير في الوقت الفعلي التي توحد أداء العرض، والامتثال للترويج، واتجاهات المبيعات الثانوية، ونشاط القوة الميدانية في لوحات معلومات موحدة. تمكن وحدة التحليلات مديري المنطقة من رؤية معدل استرداد العرض اليوم، واتجاه المبيعات الثانوية لهذا الأسبوع، ودرجة الامتثال للترويج لهذا الشهر، كل ذلك في عرض واحد. عندما يكون أداء العرض ضعيفًا، تكشف البيانات عن السبب في غضون أيام، وليس في مراجعة نهاية الربع عندما يكون الوقت قد فات لتصحيح المسار.
لوحات المعلومات في الوقت الفعلي تخدم أيضًا وظيفة محاذاة حاسمة بين العلامات التجارية والموزعين. عندما ينظر كلا الطرفين إلى نفس البيانات، تتحول المحادثات من الاتهامات ("أنت لا تنفذ عرضنا بشكل صحيح") إلى حل المشكلات ("العرض يؤدي جيدًا في الـ beats الحضرية ولكن ليس في شبه الحضرية. دعونا نفهم لماذا"). تبني المحادثات المدفوعة بالبيانات الثقة وتعزز علاقة العلامة التجارية بالموزع.
قياس ROI للتسويق التجاري
كان قياس التسويق التجاري تاريخيًا الحلقة الأضعف في تسويق FMCG. تسويق المستهلك لديه تتبع متطور: دراسات تتبع العلامة التجارية، ونماذج مزيج السوق، وتحليلات الإسناد. التسويق التجاري، على النقيض من ذلك، تم قياسه غالبًا بالإنفاق (كم استثمرنا؟) بدلاً من العائد (ما الذي حصلنا عليه؟). هذا يتغير حيث توفر منصات DMS البنية التحتية للبيانات لقياس ROI الصارم.
المقاييس الأساسية لـ ROI للتسويق التجاري
أربعة مقاييس تشكل أساس قياس التسويق التجاري:
| المقياس | التعريف | المعيار (FMCG الهندي) | كيفية الحساب |
|---|---|---|---|
| ارتفاع الحجم التزايدي | وحدات إضافية تباع تُعزى إلى العرض | 8-20% فوق خط الأساس | مبيعات فترة العرض ناقص خط الأساس قبل العرض، معدلة للموسمية |
| التكلفة لكل حالة تزايدية | الإنفاق التجاري مقسومًا على الحالات التزايدية المولدة | 15-45 روبية لكل حالة (يختلف حسب الفئة) | إجمالي تكلفة العرض / الحالات التزايدية المباعة |
| ROI للعرض | صافي الربح من الحجم التزايدي بالنسبة لتكلفة العرض | 1.5x-3.5x للعروض المصممة جيدًا | (الهامش التزايدي - تكلفة العرض) / تكلفة العرض |
| معدل تنشيط تجار التجزئة | النسبة المئوية لتجار التجزئة المؤهلين الذين شاركوا في العرض | 35-55% للتجارة العامة، 70-85% للتجارة الحديثة | تجار التجزئة المشاركون / إجمالي تجار التجزئة المؤهلين |
المقاييس الثانوية الجديرة بالتتبع
بخلاف المقاييس الأربعة الأساسية، يجب على الموزعين تتبع معدل الوعي بالعرض (ما نسبة تجار التجزئة المؤهلين الذين يعرفون عن العرض، يُقاس من خلال استبيانات مندوب المبيعات)، والاحتفاظ بعد العرض (هل يستمر تجار التجزئة في الطلب بأحجام أعلى بعد انتهاء العرض، أم يعود الطلب على الفور؟)، وارتفاع الفئة (هل ينمي العرض الفئة العامة في المنفذ، أم يحول الحصة ببساطة من علامات المنافسين؟).
الاحتفاظ بعد العرض مهم بشكل خاص. العرض الذي يولد ارتفاعًا في الحجم بنسبة 15% خلال فترته النشطة ولكن ينخفض الحجم إلى خط الأساس في غضون أسبوع قد ولّد إزاحة مؤقتة، وليس خلق طلب حقيقي. العرض الذي يولد ارتفاعًا بنسبة 10% خلال الفترة النشطة ويحتفظ بارتفاع 5% لمدة 4-6 أسابيع بعد ذلك قد غير سلوك تخزين تاجر التجزئة، وهو الهدف النهائي للتسويق التجاري.
وضع المعايير
تختلف المعايير بشكل كبير حسب الفئة والقناة والمنطقة. ومع ذلك، تمثل النطاقات التالية الأداء النموذجي للتسويق التجاري المنفذ جيدًا في FMCG الهندي:
- السلع الأساسية والسلع (الأتا، الزيت، الأرز): الهوامش المنخفضة تعني أن ROI للعرض يجب أن يُقاس بعناية. توقع 1.2-2.0x ROI و5-12% ارتفاع حجم تزايدي. حساسية التكلفة عالية.
- الأطعمة المعبأة (البسكويت، الوجبات الخفيفة، النودلز): الهوامش الأعلى تدعم عروضًا أكثر عدوانية. توقع 1.8-3.0x ROI و10-20% ارتفاع حجم تزايدي. سلوك الشراء الاندفاعي يضخم استثمارات العرض.
- العناية الشخصية والعناية المنزلية: أعلى الهوامش في FMCG. توقع 2.0-3.5x ROI و12-25% ارتفاع حجم تزايدي. معدلات تنشيط تجار التجزئة حاسمة لأن هذه الفئات تتنافس على مساحة رف محدودة.
- المشروبات والألبان: أنماط الطلب الموسمي تؤثر بشكل كبير على ROI. عروض الصيف للمشروبات يمكن أن تقدم 3-5x ROI، بينما تكافح عروض خارج الموسم للوصول إلى نقطة التعادل. الطزاجة والتوفر، التي يتم تتبعها من خلال بيانات على مستوى تاجر التجزئة، لا تقل أهمية عن حوافز التسعير.
الموزعون الذين يزودون العلامات التجارية بهذه المقاييس، المحسوبة من بيانات DMS بدلاً من تقديرها من الذاكرة، يصبحون شركاء استراتيجيين يؤثرون على استثمارات التسويق التجاري المستقبلية. هذا النموذج الشراكة المدفوع بالبيانات هو مستقبل علاقات العلامة التجارية-الموزع في FMCG الهندي.
دراسات حالة: تحول التسويق التجاري المُمكَّن بـ DMS
دراسة حالة 1: علامة أطعمة معبأة إقليمية في غرب الهند
واجهت علامة أطعمة معبأة متوسطة الحجم تعمل في غوجارات وراجستان مع 280 موزعًا وإيرادات سنوية تبلغ 320 كرور روبية مشكلة مستمرة: كان إنفاقها على التسويق التجاري 48 كرور روبية سنويًا (15% من الإيرادات)، لكن لم تكن لديها أي رؤية حول العروض التي تعمل. أدارت العلامة التجارية 22 عرضًا نشطًا في وقت واحد، تتم إدارتها من خلال تعميمات Excel ترسل عبر البريد الإلكتروني إلى الموزعين شهريًا. كان تطبيق العرض يدويًا أثناء إصدار الفواتير، واعتمدت العلامة التجارية على تسوية المطالبات ربع السنوية للتحقق من الإنفاق.
كشف تدقيق داخلي عن ثلاثة نتائج مقلقة. أولاً، كان تسرب العرض (الفوائد المطبقة على المنافذ غير المؤهلة أو تجاوز حدود الميزانية) يصل إلى 18% من إجمالي الإنفاق التجاري، حوالي 8.6 كرور روبية سنويًا في الإنفاق المهدر. ثانياً، بلغ متوسط معدلات تنشيط تجار التجزئة 38% فقط، مما يعني أن ما يقرب من ثلثي تجار التجزئة المؤهلين لم يكونوا مشاركين في العروض لأن مندوبي المبيعات لم يوصلوها. ثالثاً، لم يكن لدى العلامة التجارية أي آلية لقياس الحجم التزايدي، لذلك لم يستطيعوا التمييز بين العروض التي دفعت النمو والعروض التي دعمت ببساطة الطلب الموجود.
بعد نشر DMS مع محرك عروض متكامل ومنصة تحليلات، كانت النتائج على مدى 12 شهرًا كبيرة. انخفض تسرب العرض من 18% إلى أقل من 2%، مما استرد 7.7 كرور روبية في الإنفاق التجاري السنوي. ارتفعت معدلات تنشيط تجار التجزئة من 38% إلى 67% حيث استخدم مندوبو المبيعات تطبيق الهاتف المحمول لتوصيل العروض خلال كل زيارة. حددت العلامة التجارية 6 من بين 22 عرضًا على أنها تولد ROI سلبيًا وأوقفتها، وأعادت تخصيص 12 كرور روبية إلى الـ 8 العروض الأعلى أداءً. النتيجة الصافية: تحسنت فعالية التسويق التجاري بنسبة 42% بينما انخفض إجمالي الإنفاق التجاري بنسبة 8%.
دراسة حالة 2: علامة ألبان وطنية تتوسع في الأسواق الجنوبية
نشرت علامة ألبان وطنية تدخل كارناتاكا وتاميل نادو 85 موزعًا جديدًا عبر منطقة توزيع FMCG في بنغالور، وتشيناي، وكويمباتور، وميسور. تطلب التوسع تسويقًا تجاريًا عدوانيًا لبناء توزيع التجزئة من الصفر في سوق تنافسية تهيمن عليها العلامات التجارية الإقليمية الراسخة. كان النهج الأولي تقليديًا: وزعت الفرق الميدانية تعميمات عروض مطبوعة، وشحنت مواد POP إلى الموزعين، وكان تطبيق العرض يدويًا.
بعد 6 أشهر، كان اختراق التجزئة عند 22% فقط من الهدف، أقل بكثير من المعيار 45% المتوقع لعلامة وطنية تدخل سوقًا جديدة. كشف تحليل ما بعد الوفاة عن الأسباب: 40% من مواد POP لم يتم نشرها (لا تزال في مستودعات الموزعين)، وكان توصيل العرض غير متسق (مندوبو مبيعات مختلفون يوصلون إصدارات مختلفة من نفس العرض)، ولم تكن هناك أي آلية للتحقق مما إذا كانت عروض التجزئة قد تم إعدادها بالفعل.
نفذت العلامة التجارية DMS مع SFA المحمول، والتقاط الصور الإلزامي للتحقق من نشر POP، وتوصيل العرض الآلي من خلال التطبيق. في غضون 4 أشهر من النشر، وصل نشر مواد POP إلى 88% (ارتفاعًا من 60%). أصبحت دقة توصيل العرض 100% حيث عرض التطبيق العرض الصحيح والحالي لكل منفذ. والأهم من ذلك، يمكن للعلامة التجارية الآن إجراء اختبار A/B لمتغيرات العرض عبر المناطق. اختبروا خصمًا ثابتًا قدره 50 روبية لكل حالة في بنغالور مقابل حافز قائم على الشرائح (اشترِ 5 احصل على 1 مجانًا) في تشيناي. كشفت البيانات من وحدة تتبع التوزيع أن الحافز القائم على الشرائح ولد حجمًا تزايديًا أعلى بنسبة 31% بتكلفة أقل بنسبة 12% لكل حالة تزايدية. تم تطبيق هذه الرؤية على المستوى الوطني عبر جميع مداخل السوق الجديدة، مما وفر ما يقدر بـ 4.5 كرور روبية سنويًا في مكاسب كفاءة التسويق التجاري.
هل أنت مستعد لتحويل تنفيذ التسويق التجاري لديك؟ توفر منصة إدارة التوزيع من SpireStock محرك العروض، وأتمتة القوة الميدانية، والتحليلات التي يحتاجها موزعو FMCG لسد فجوة التنفيذ بين استراتيجية العلامة التجارية ورف التجزئة. احجز عرضًا تجريبيًا مجانيًا لمعرفة كيف يعمل لشبكة التوزيع لديك، أو راجع خطط التسعير للعثور على المناسب لنطاقك.
المصادر والمراجع
- IBEF, India Brand Equity Foundation, FMCG Sector Report
- Nielsen IQ, NielsenIQ India Retail Intelligence and Trade Promotion Analytics
- FICCI, Federation of Indian Chambers of Commerce and Industry, FMCG Sector
- Kantar, Kantar Worldpanel India FMCG and Retail Insights
الأسئلة المتكررة
التسويق التجاري هو تسويق موجه إلى قناة التجارة، والموزعين، وتجار الجملة، وتجار التجزئة، بدلاً من المستهلكين النهائيين. يشمل العروض التجارية، وترويج التجزئة، ونشر مواد POP، ووضع الرفوف، وإدارة علاقات تجار التجزئة. تنفق شركات FMCG الهندية عادةً من 15 إلى 25% من الإيرادات على التسويق التجاري لضمان توفر المنتجات ووضوحها وتموضعها تنافسيًا عند نقطة الشراء.
يستهدف تسويق المستهلك المتسوقين النهائيين عبر قنوات مثل التلفزيون والرقمية والمطبوعة لإنشاء الوعي بالعلامة التجارية والطلب. يستهدف التسويق التجاري الموزعين وتجار التجزئة من خلال العروض والعروض المرئية ومواد POP وحوافز الهامش لضمان توفر المنتجات ووضوحها عند نقطة الشراء. ينشئ تسويق المستهلك الجذب بينما ينشئ التسويق التجاري الدفع. يجب أن يعمل كلاهما بتزامن من أجل توزيع FMCG فعال.
ينفذ الموزعون خطط التسويق التجاري التي تصممها العلامات التجارية. يشمل ذلك توصيل العروض التجارية إلى تجار التجزئة خلال زيارات الـ beat اليومية، ونشر مواد POP في المنافذ المستهدفة، وضمان وضع الرفوف والامتثال للترويج، وتطبيق فوائد العروض بدقة أثناء إصدار الفواتير، وتوفير بيانات المبيعات الثانوية لقياس فعالية العرض. الموزع هو جسر التنفيذ بين استراتيجية العلامة التجارية وواقع التجزئة.
يُقاس ROI للتسويق التجاري من خلال أربعة مقاييس أساسية: ارتفاع الحجم التزايدي (المبيعات الإضافية التي تُعزى إلى العرض، عادةً 8-20% فوق خط الأساس)، والتكلفة لكل حالة تزايدية (15-45 روبية حسب الفئة)، وROI للعرض (صافي الربح من الحجم التزايدي مقارنةً بتكلفة العرض، المعيار 1.5-3.5x)، ومعدل تنشيط تجار التجزئة (نسبة تجار التجزئة المؤهلين الذين شاركوا، عادةً 35-55% في التجارة العامة). توفر منصات DMS مع تتبع المبيعات الثانوية البيانات لهذه الحسابات.
يحدث تسرب العروض عندما يتم تطبيق فوائد الترويج التجاري بشكل غير صحيح، أو تصل إلى منافذ غير مؤهلة، أو تتجاوز سقوف الميزانية، أو يتم حسابها بشكل خاطئ أثناء إصدار الفواتير. في FMCG الهندية، يتراوح تسرب العروض عادةً بين 20-35% من إجمالي الإنفاق التجاري عند إدارته يدويًا. يقلل نظام DMS مع محرك عروض متكامل التسرب إلى أقل من 2% من خلال أتمتة فحوصات الأهلية وحسابات الفوائد وتنفيذ الميزانية.
تقيس حصة الرف النسبة المئوية لإجمالي مساحة الرفوف المتاحة ضمن فئة منتج التي تشغلها علامة تجارية في منفذ بيع بالتجزئة. ترتبط مباشرة بالمبيعات: زيادة حصة الرف بمقدار 10 نقاط مئوية تقدم عادةً ارتفاعًا في المبيعات بنسبة 5-8%. تُقاس حصة الرف من خلال عمليات تدقيق القوة الميدانية مع التقاط الصور، وبشكل متزايد من خلال التعرف على الصور المدعوم بـ AI في قنوات التجارة الحديثة.
يحسن نظام إدارة التوزيع تنفيذ التسويق التجاري بأربع طرق: يطبق محرك العروض فوائد العروض الصحيحة تلقائيًا أثناء إصدار الفواتير بدقة 100%، ويوصل تطبيق SFA المحمول العروض المعمول بها إلى مندوبي المبيعات في كل زيارة منفذ، ويتحقق التقاط الصور وتتبع GPS من نشر POP والامتثال للترويج، وتقيس لوحات معلومات التحليلات ROI للعرض على مستوى المنطقة والمنفذ في الوقت الفعلي. معًا، تسد هذه القدرات فجوة التنفيذ بين استراتيجية العلامة التجارية ورف التجزئة.
الركائز الخمس هي: التسعير والهوامش (ضمان هياكل هامش تنافسية وشفافة لتجار التجزئة)، والترويج والعرض (حصة الرف، والامتثال للـ planogram، والوضوح داخل المتجر)، والعروض والترويج التجاري (الخصومات الثابتة، وحوافز الشرائح، والعروض الموسمية)، وإدارة علاقات تجار التجزئة (الانخراط القائم على البيانات مع عالم المنفذ)، والبيانات والتحليلات (قياس المبيعات الثانوية، وتتبع ROI للعرض، وتحليل الأداء على مستوى المنطقة).
ميزات SpireStock ذات الصلة
مخططات حوافز مرنة، مسطحة وحزمة بالجملة وكميات، تُطبّق تلقائياً.
لوحات قوية مع اتجاهات المبيعات وتقارير MIS وتحليلات التوزيع.
حضور موسوم جغرافياً مع التحقق من الموقع وتحليلات السفر.
تتبع GPS في الوقت الفعلي للمركبات والسائقين مع تحسين المسار لتوصيلات أسرع.
تطبيق جوال للموزعين وتجار التجزئة وفرق التوصيل.
صناعات ذات صلة
حلول ذات صلة
أتمتة المخططات التجارية والحوافز والعروض الترويجية. مخططات ثابتة وحزمة جماعية وكمية وFOC مع تتبع ROI. جرّب SpireStock.
تتبع وإدارة شبكة التجزئة الخاصة بك. وسم المنافذ جغرافيًا والتقاط المبيعات الثانوية وإدارة المسارات ومراقبة أداء تجار التجزئة. جرّب SpireStock.
تعزيز إنتاجية فريق المبيعات الميداني مع تخطيط المسار وحضور GPS والتقاط الطلبات وتحليلات الأداء. مبني لفرق FMCG الهندية.
كيانات ذات صلة
هل أنت مستعد لتبسيط عملية التوزيع؟
ابدأ تجربتك المجانية لمدة 30 يوماً واكتشف كيف يمكن لـ SpireStock تحويل عملية توزيع الألبان أو السلع الاستهلاكية الخاصة بك، من استلام الطلبات إلى استرداد الصناديق.
SpireStock Team
خبراء تكنولوجيا التوزيع
يكتب SpireStock Team لصالح SpireStock حول إدارة التوزيع وتحسين سلسلة التوريد والعمليات الميدانية لعلامات الألبان وFMCG الهندية.


