What Is a DSR in FMCG?
In FMCG distribution, DSR stands for Daily Sales Report. It is the daily heartbeat of field sales operations. Every salesman, delivery executive, and field representative in India's consumer goods industry submits a DSR at the end of each working day. The DSR is not optional. It is the atomic unit of sales management, the raw data from which every downstream decision is made: territory planning, incentive calculations, demand forecasting, production scheduling, and competitive strategy.
A well-structured DSR captures six categories of field activity. First, it records which outlets the salesman visited, providing a factual trail of attendance and route adherence. Second, it documents every order taken: the products, quantities, values, and schemes applied. Third, it tracks collections made against outstanding invoices. Fourth, it logs returns and expiry claims processed in the field. Fifth, it captures new outlets added to the coverage universe. Sixth, and often undervalued, it records qualitative observations: competitor activity, retailer feedback, planogram compliance, and market conditions.
Think of the DSR as a field intelligence report that doubles as a transaction log. Without it, management is making decisions based on memory, phone calls, and monthly aggregates that arrive too late to be actionable. With it, every stakeholder from the area sales manager to the national sales head can see exactly what happened on the ground today, not last week, not last month, but today.
In the Indian FMCG context, where a single distributor may have 8-12 salesmen covering 2,000-5,000 retail outlets across multiple beats, the DSR is the connective tissue between the field and the office. It connects distribution tracking to sales analytics, transforming raw field activity into management intelligence. Every serious FMCG company, from Hindustan Unilever to a regional namkeen brand, runs on DSR data.
Why the DSR Matters
The difference between a well-managed FMCG sales operation and a chaotic one is almost always the quality and timeliness of DSR data. Consider what happens without reliable DSRs: the area sales manager does not know which beats were covered today. The distributor does not know whether his salesmen actually visited outlets or sat in a tea shop. The brand manager does not know if the new scheme is being communicated to retailers. The supply chain team does not know which SKUs are flying off shelves and which are gathering dust. Everyone operates on assumptions, and assumptions in distribution are expensive.
With consistent, accurate DSR data, four critical capabilities become possible:
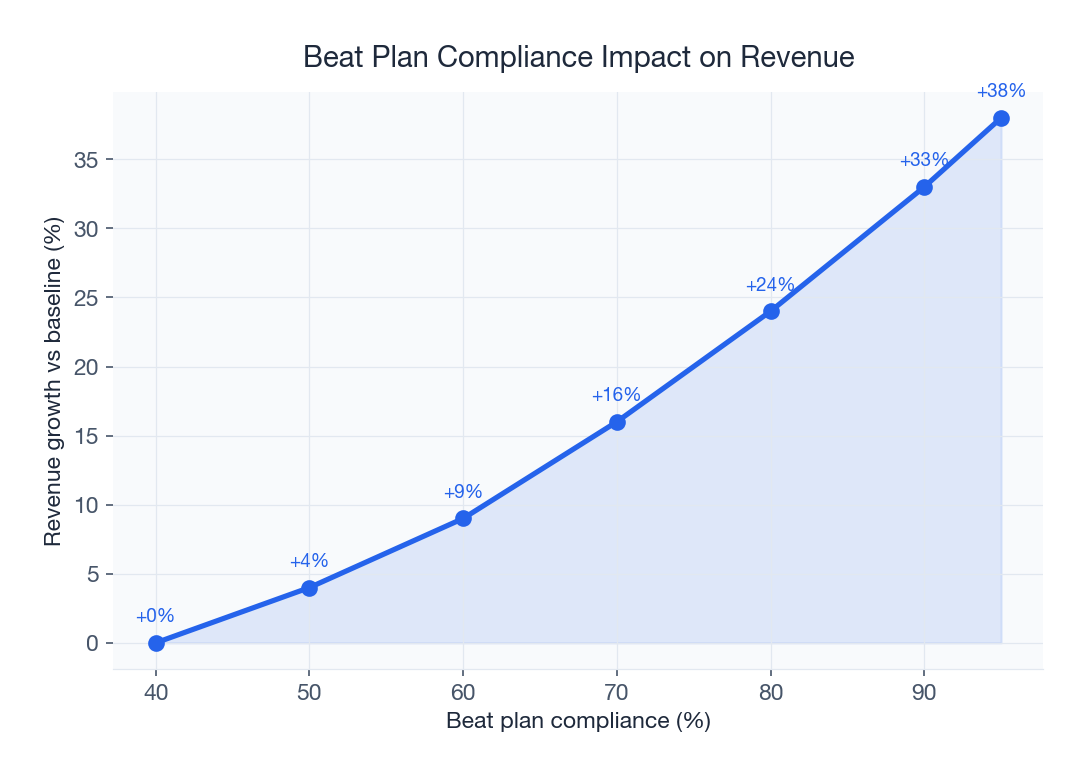
- Beat adherence visibility. Management can see whether salesmen followed their assigned beat plans or deviated. Beat discipline is the foundation of outlet coverage. Without DSR-based tracking, even the best beat plan is just a suggestion. Companies with strong beat adherence typically achieve 15-25% higher outlet coverage than those without.
- Secondary sales tracking. Primary sales (what the company sells to the distributor) tell you about billing. Secondary sales (what the distributor sells to retailers) tell you about actual demand. DSR data, specifically the orders taken at each outlet, is the primary source of secondary sales intelligence. Without it, demand planning relies on primary billing data that may reflect inventory loading, not consumer demand.
- Salesman productivity measurement. DSR data enables objective measurement of every field representative. How many outlets did they visit? What percentage were productive calls? What was the average order value? How many lines per call? These metrics, derived directly from DSR data, replace subjective assessments with quantifiable performance scores. Companies that measure sales productivity rigorously outperform those that manage by gut feel.
- Demand signals for planning. When aggregated across hundreds of salesmen and thousands of outlets, DSR data reveals demand patterns invisible at the individual transaction level. A SKU consistently ordered in smaller quantities across a territory signals a pricing problem. A new outlet cluster placing orders in a previously uncovered pin code signals expansion opportunity. These demand signals flow from DSR data to brand teams to production planning.
The DSR is not a compliance document that salesmen fill to keep managers happy. It is the foundation of data-driven distribution management. Every decision, from tomorrow's dispatch loading to next quarter's scheme design, is only as good as the DSR data feeding it.
The 10 Essential Fields Every DSR Should Include
Across Indian FMCG companies, DSR formats vary. Some have 8 fields. Some have 25. But after working with hundreds of distributors across FMCG distribution operations, we have identified the 10 fields that are non-negotiable. These 10 fields balance completeness with practicality: they capture everything management needs without burdening the salesman with excessive data entry. Remove any one of these and you lose a critical dimension of field intelligence.
- Date. The reporting date. Sounds obvious, but paper-based DSRs frequently arrive with the wrong date or no date at all. In a digital DSR, the date is auto-populated and cannot be altered.
- Salesman name and code. Every DSR must be tied to a specific field representative. The salesman code links to master data: assigned territory, reporting manager, active schemes, targets, and incentive slabs.
- Beat/route name. Which beat or route was the salesman covering today? This field enables beat adherence tracking. If the salesman was assigned Beat A but the DSR shows outlets from Beat C, that is a deviation that needs explanation.
- Outlets planned vs. outlets visited. The beat plan defines how many outlets the salesman should visit. The DSR captures how many were actually visited. The ratio between these two numbers is beat adherence percentage, one of the most important KPIs in FMCG field sales.
- Productive calls (orders taken). Of the outlets visited, how many resulted in an order? An outlet visit without an order is an unproductive call. The ratio of productive calls to total visits is the strike rate, and it directly measures selling effectiveness.
- Total order value. The rupee value of all orders taken during the day. This is the most basic measure of daily output. When tracked over time, it reveals trends, seasonality, and the impact of schemes and promotions.
- Collections. Cash and cheque collections made against outstanding invoices. Collection efficiency is a critical metric for distributor health. A salesman who generates orders but does not collect outstanding payments is creating a receivables problem.
- Returns and damage. Products returned by retailers, whether damaged, expired, or unsold. Returns data feeds into claims processing, expiry management, and product quality reviews. Ignoring returns in the DSR creates reconciliation nightmares at month-end.
- New outlets added. Any new retail outlet opened or onboarded during the day. Numeric growth in outlet universe is a leading indicator of distribution expansion. Tracking new outlets at the DSR level ensures the retailer database stays current.
- Remarks and competitor information. A free-text field for the salesman to report competitor activity (new product launches, pricing changes, scheme aggressiveness), retailer feedback, market conditions, and any issues encountered. This qualitative data is often the most valuable intelligence in the entire DSR.
These 10 fields form the minimum viable DSR. Any format that lacks one of these fields has a blind spot. Any format that adds more fields should do so only with clear justification, because every additional field adds friction to the salesman's daily workflow.
DSR Template: The Standard Format
Below is a complete DSR template showing a full day's worth of field activity for an FMCG salesman covering 15 retail outlets. This format is used by hundreds of distributors across India and can be adapted for any product category: packaged foods, dairy, beverages, personal care, or home care.
Daily Sales Report -- 15 June 2025
Salesman: Rajesh Kumar (Code: SK-047) | Beat: Market Road - Zone A | Distributor: Sharma FMCG Distributors, Jaipur
| S.No. | Outlet Name | Visit Time | Order Taken | Order Value (Rs) | Collection (Rs) | Returns (Rs) | New Outlet | Remarks |
|---|---|---|---|---|---|---|---|---|
| 1 | Sharma General Store | 09:15 AM | Yes | 3,450 | 2,800 | 0 | No | Requested 500g pack of masala range |
| 2 | Gupta Kirana | 09:40 AM | Yes | 5,200 | 5,200 | 150 | No | Competitor Brand X running buy-2-get-1 on biscuits |
| 3 | Raj Supermart | 10:05 AM | Yes | 12,800 | 8,000 | 0 | No | Good shelf space; wants end-rack display |
| 4 | Balaji Provision | 10:30 AM | No | 0 | 1,500 | 0 | No | Shop closed for renovation, collected pending amount |
| 5 | Lakshmi Store | 10:50 AM | Yes | 2,100 | 0 | 0 | No | Low footfall, reduced order this week |
| 6 | Mahesh Traders | 11:20 AM | Yes | 8,900 | 6,500 | 320 | No | Competitor scheme aggressive; needs counter offer |
| 7 | New India Grocers | 11:45 AM | Yes | 4,600 | 4,600 | 0 | Yes | New outlet opened last week, first order placed |
| 8 | Patel Corner Shop | 12:10 PM | No | 0 | 0 | 0 | No | Owner unavailable, will revisit tomorrow |
| 9 | Sundar Provision Store | 12:35 PM | Yes | 6,300 | 3,000 | 0 | No | Placed larger order, expecting festive demand |
| 10 | Agarwal Mart | 01:30 PM | Yes | 9,750 | 9,750 | 200 | No | Premium pack moving well; returned 2 damaged units |
| 11 | City Choice Supermarket | 02:00 PM | Yes | 15,400 | 10,000 | 0 | No | Requested category-wise scheme chart |
| 12 | Krishna General | 02:30 PM | No | 0 | 2,200 | 0 | No | Excess stock from last order, only collected payment |
| 13 | Om Sai Kirana | 03:00 PM | Yes | 3,800 | 3,800 | 0 | No | Small outlet, consistent reorders every visit |
| 14 | Fresh Mart | 03:25 PM | Yes | 7,200 | 0 | 450 | No | Near-expiry stock returned, fresh stock ordered |
| 15 | Deepak Provision | 03:50 PM | Yes | 4,100 | 4,100 | 0 | Yes | New outlet onboarded; took introductory order |
Day Summary:
| Metric | Value |
|---|---|
| Outlets Planned | 16 |
| Outlets Visited | 15 |
| Beat Adherence | 93.75% |
| Productive Calls | 12 |
| Strike Rate | 80.0% |
| Total Order Value | Rs 83,600 |
| Total Collections | Rs 61,450 |
| Total Returns | Rs 1,120 |
| New Outlets | 2 |
| Average Order Value | Rs 6,967 |
This template is deliberately practical. It records the data managers need without requiring the salesman to spend 30 minutes filling forms at the end of the day. In a digital DSR system, most of these fields are auto-populated: the visit time comes from GPS check-in, the order value is calculated from line items, and collections are linked to invoices. The salesman only needs to add the order items and remarks.
Advanced DSR Fields for Modern FMCG
The 10 essential fields cover the basics. But modern FMCG distribution, especially for companies competing against organized retail and e-commerce, demands a richer data layer. The following advanced fields transform the DSR from a simple activity report into a comprehensive field intelligence platform. These fields are impractical on paper but straightforward in a mobile app-based DSR system.
GPS Check-in and Check-out Time
Instead of a self-reported visit time, GPS-verified check-in and check-out timestamps prove that the salesman was physically present at the outlet. The time difference between check-in and check-out reveals dwell time, a key indicator of engagement quality. A 2-minute visit is likely just a stock check or a no-order drop-in. A 12-minute visit suggests genuine selling, relationship building, and scheme communication. GPS data also feeds into field force tracking dashboards that show real-time salesman locations across the territory.
Photo Proof of Visit
Geotagged photographs taken at the outlet provide visual evidence of the visit. More importantly, photos of shelf displays, competitor product placement, and promotional material compliance create a visual audit trail. Brand managers can review shelf-share without traveling to the market. Planogram compliance, which is almost impossible to measure through text fields, becomes measurable through photo proof.
SKU-Level Order Breakdown
The basic DSR captures total order value. An advanced DSR captures every SKU ordered: product name, variant, pack size, quantity, unit price, scheme applied, and net value. SKU-level data enables product mix analysis, identifies fast and slow movers at the outlet level, and feeds demand forecasting models. When combined with the order management system, this data also enables real-time inventory depletion tracking at the distributor level.
Scheme Utilization
Which trade schemes were applied at each outlet? Was the retailer aware of the running promotions? Did the scheme influence the order quantity? Scheme utilization data closes the loop between scheme design and market execution. Without it, brands spend crores on trade promotions with no visibility into whether the schemes actually reached the intended outlets.
Planogram Compliance
For companies with defined shelf display standards, the DSR can capture a planogram compliance score: whether the right products are displayed in the right position, with correct pricing labels and promotional signage. This field is particularly important for modern trade outlets where shelf positioning directly impacts sales velocity.
Retailer Feedback
A structured feedback field that captures retailer sentiment on product quality, pricing, delivery timeliness, and scheme attractiveness. Unlike the general remarks field, structured feedback uses predefined categories that can be aggregated and analyzed at scale. A spike in negative feedback about delivery delays in a specific territory is an early warning signal that the logistics team needs to investigate.
Next Visit Action
What should happen at the next visit? Does the retailer need a follow-up on a pending order? Is a demo scheduled for a new product? Does the credit limit need review? The next visit action field creates continuity between visits, ensuring that promises made in the field are tracked and fulfilled. In a digital DSR, these actions automatically appear as reminders when the salesman plans the next beat.
KPIs to Track From DSR Data
Raw DSR data is valuable. DSR-derived KPIs are transformational. The following seven metrics should be calculated daily from DSR submissions and tracked on management dashboards. Each metric comes with benchmarks drawn from Indian FMCG operations to help you calibrate performance against industry standards.
1. Productive Call Percentage
Formula: (Number of outlets where orders were taken / Total outlets visited) x 100
What it measures: The proportion of outlet visits that result in an order. This is the most fundamental measure of field selling effectiveness.
Indian FMCG benchmark: 60-75% for established territories, 40-55% for new territories under development. Top-performing salesmen consistently achieve 80%+ productive call rates.
Why it matters: A salesman visiting 30 outlets with a 50% productive call rate generates the same order count as one visiting 20 outlets with a 75% rate, but the second salesman does it with 33% less effort. Productive call percentage separates efficient sellers from busy walkers.
2. Strike Rate
Formula: (Productive calls / Outlets planned for the day) x 100
What it measures: Strike rate differs from productive call percentage in that it uses planned outlets as the denominator, not visited outlets. This means it penalizes salesmen who skip difficult outlets and cherry-pick easy ones.
Indian FMCG benchmark: 50-65% is considered good. Above 70% is excellent. Below 40% warrants coaching intervention.
3. Average Order Value (AOV)
Formula: Total order value / Number of productive calls
What it measures: How much revenue each successful outlet visit generates. AOV trends reveal whether salesmen are upselling effectively, whether schemes are driving larger orders, and whether premium products are getting traction.
Indian FMCG benchmark: Varies significantly by category. For packaged foods distribution, Rs 3,000-8,000 per call is typical. For personal care and home care, Rs 2,000-6,000. For dairy and beverages, Rs 1,500-5,000 due to daily ordering patterns.
4. Lines Per Call (LPC)
Formula: Total SKUs ordered across all outlets / Number of productive calls
What it measures: Product range selling effectiveness. A high LPC means the salesman is selling across the product portfolio, not just the fast movers. This is critical for brands with deep product lines.
Indian FMCG benchmark: 4-6 lines per call for general trade. 8-12 for modern trade. Companies with structured must-sell lists typically achieve 20-30% higher LPC than those without.
5. Beat Adherence Percentage
Formula: (Outlets visited that were on the planned beat / Total outlets on the planned beat) x 100
What it measures: Whether salesmen follow the assigned route plan or deviate to preferred outlets. Beat adherence is the backbone of systematic market coverage. Without it, some outlets get over-serviced while others go weeks without a visit.
Indian FMCG benchmark: 85-95% is the target range for mature operations. Below 80% indicates weak beat discipline and requires immediate managerial attention. GPS-enabled DSR systems have improved average beat adherence from 65% (paper-based) to 88% (digital) across Indian FMCG operations.
6. Collection Efficiency
Formula: (Total collections in the period / Total outstanding amount at the beginning of the period) x 100
What it measures: How effectively salesmen collect payments against dues. High order generation with low collection efficiency creates cash flow problems for the distributor. In the Indian FMCG context, where credit periods of 7-21 days are common, collection efficiency determines whether the distributor can sustain operations or drowns in receivables.
Indian FMCG benchmark: 70-85% monthly collection efficiency is standard. Below 65% indicates systemic collection problems. Above 90% is excellent and typically seen in dairy distribution where daily billing and collection cycles compress the credit period.
7. New Outlet Conversion Rate
Formula: (New outlets that placed a second order within 30 days / Total new outlets added) x 100
What it measures: Whether newly onboarded outlets convert into regular customers or remain one-time entries in the database. Adding new outlets is easy. Retaining them requires follow-up, scheme communication, and reliable delivery, all of which the DSR should track.
Indian FMCG benchmark: 40-55% conversion within 30 days. Top-performing territories achieve 65%+ conversion by pairing new outlet onboarding with structured follow-up visits in the first 3 beats.
Manual DSR vs Digital DSR
The majority of Indian FMCG distributors, particularly those outside the top 50 cities, still use paper-based DSRs. The salesman carries a printed or photocopied form, fills it by hand at the end of the day, and submits it to the distributor office. The data is then manually entered into an Excel sheet or left in a filing cabinet. This workflow has five fundamental problems that no amount of process discipline can overcome:
The 5 Fatal Flaws of Paper DSRs
- Late submission. Paper DSRs arrive when the salesman returns to the office, which may be 6 PM or the next morning. By the time the data reaches the area sales manager, it is already stale. A problem reported in yesterday's DSR could have been addressed in real time if the data had flowed instantly. Late submission turns the DSR from a management tool into a historical record.
- Illegibility and errors. Handwritten DSRs suffer from illegible handwriting, incorrect totals, missing fields, and transposition errors. When a data entry operator transcribes these into Excel, errors compound. By the time the aggregated DSR data reaches management, it may contain a 10-15% error rate that nobody detects because nobody can verify it against the field reality.
- Fake entries. This is the uncomfortable truth that paper DSR systems cannot solve: a significant minority of field representatives fabricate visit data. They report visiting outlets they never went to, inflate order values that never materialize into actual invoices, and create phantom new outlets that do not exist. Without GPS verification, there is no way to distinguish genuine entries from fabricated ones.
- No real-time visibility. Paper DSRs are batch-processed. Even if they arrive on time and are perfectly legible, the data is only available after manual entry, which may take hours or days. Managers cannot see what is happening in the field right now. They can only see what happened yesterday, and only after someone types it into a spreadsheet.
- Impossible to aggregate. When DSR data lives in paper forms and individual Excel files, aggregating it across salesmen, beats, territories, and time periods is a manual nightmare. Generating a weekly territory performance report from paper DSRs requires someone to manually compile data from dozens of sources. This delays insights by days or weeks and makes the data effectively useless for operational decision-making.
Digital DSR: The Mobile-First Alternative
A digital DSR system replaces the paper form with a mobile application that the salesman uses throughout the day. Instead of filling a form at the end of the day, the salesman records each activity as it happens: check-in at an outlet, take an order, collect payment, log a return, add remarks. The data flows in real time to a cloud-based dashboard accessible by the distributor, area sales manager, and brand team simultaneously.
The advantages are not incremental. They are categorical:
- Real-time data flow. The moment a salesman checks into an outlet, the visit appears on the management dashboard. Orders, collections, and returns are visible within seconds of being recorded. A manager sitting in a regional office can see field activity across 50 salesmen in real time, something paper DSRs can never deliver.
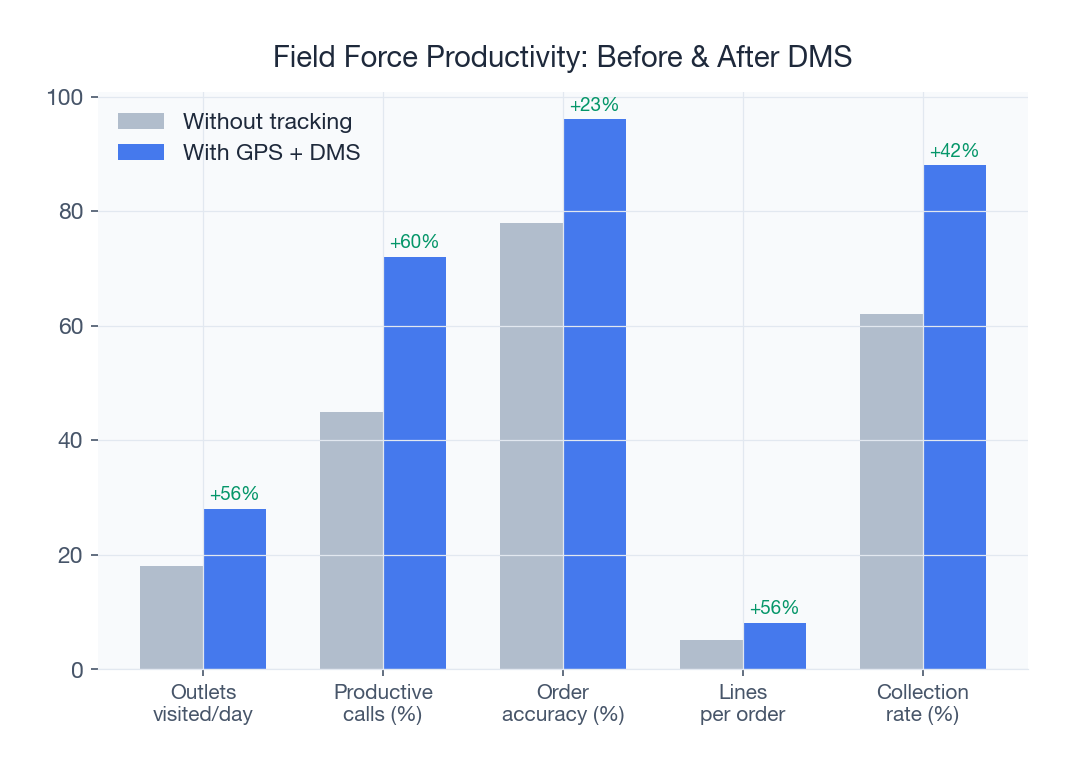
- GPS verification. Every check-in is tagged with GPS coordinates and a timestamp. If the salesman is not physically at the outlet location, the system flags the discrepancy. This eliminates fake visits entirely. Field force tracking with GPS has been shown to reduce ghost visits by 85-95% within the first month of deployment.
- Auto-calculated metrics. Order values, collection totals, productive call percentages, and beat adherence scores are calculated automatically. No manual tallying, no formula errors, no version control issues. The numbers are always current and always correct.
- Instant analytics. Because the data is structured and digital from the point of capture, analytics are available instantly. A manager does not wait for a weekly MIS report. They open a dashboard and see today's performance across every metric that matters: territory-wise, salesman-wise, product-wise, and outlet-wise.
- Historical comparison. Digital DSR data accumulates over weeks and months, enabling trend analysis that is practically impossible with paper records. Is strike rate improving or declining? Is a particular beat losing productivity? Is a specific salesman's performance deteriorating? Digital DSR data answers these questions with a few clicks.
The transition from paper to digital DSR is not a technology upgrade. It is a management transformation. Companies that make this transition consistently report 20-35% improvement in field productivity within the first quarter, not because the salesmen suddenly became better, but because visibility drove accountability, and accountability drove behavior change.
How to Automate DSR With a DMS
The most effective way to implement digital DSR is not through a standalone app but through a Distribution Management System (DMS) that integrates DSR capture with order management, inventory, billing, and analytics. When the DSR is embedded in the operational workflow rather than bolted on as a separate reporting tool, the data is richer, more accurate, and immediately actionable.
SpireStock's mobile app auto-generates the DSR from field activity without requiring the salesman to fill a separate form. Here is how it works:
- Morning sync. The salesman opens the app at the start of the day. The system loads today's beat plan, showing the outlets to visit, their sequence, outstanding balances, last order history, and any pending actions from previous visits. Attendance is marked automatically with GPS verification.
- Outlet check-in. When the salesman arrives at an outlet, they tap "Check In." The app records GPS coordinates and timestamp. If the salesman is not within the geo-fenced radius of the outlet, the check-in is flagged. The retailer profile appears with purchase history, credit limit, outstanding balance, and applicable schemes.
- Order capture. The salesman browses the product catalog, adds items to the order, and the system auto-applies relevant schemes. The order management module validates credit limits, checks stock availability, and calculates the net payable amount. No manual calculation required.
- Collection recording. If the salesman collects payment, it is recorded against specific invoices with the payment mode (cash, cheque, UPI). The outstanding balance updates in real time for both the retailer and the distributor.
- Check-out and next outlet. The salesman checks out, and the app suggests the next outlet based on the beat sequence and route optimization. The entire visit duration, order value, and collection amount are logged automatically.
- Auto-generated DSR. At the end of the day, the DSR is already complete. Every visit, order, collection, return, and remark has been captured in real time. The salesman does not fill a separate form. The manager does not wait for submissions. The DSR exists as a live dashboard that updates throughout the day.
The result is zero paper and zero delay. Managers see live analytics dashboards showing field activity across their entire territory. Exceptions (missed outlets, low strike rate, unusual order patterns) are flagged automatically. Daily review meetings, which previously depended on someone compiling data from paper forms, now start with a real-time dashboard that everyone in the room can see.
For distributors managing dairy or perishable FMCG products, where daily ordering cycles make timely DSR data even more critical, the automated approach eliminates the reporting lag that causes missed demand signals and over/under-stocking.
Common DSR Problems and How to Solve Them
Even the best-designed DSR format will fail if the underlying operational problems are not addressed. Here are the four most common DSR problems in Indian FMCG distribution and the systemic solutions for each.
Problem 1: Fake Visits
The problem: Salesmen report visiting outlets they never went to. They may check off 25 outlets on the DSR but actually visit only 15, spending the rest of the day on personal errands or sitting idle. In paper-based systems, there is no way to verify presence short of sending a supervisor to the market, which is impractical at scale.
Solution: GPS-verified check-ins. Require GPS check-in within a defined radius (typically 100-200 meters) of the outlet's registered coordinates. The mobile app captures the latitude, longitude, and timestamp of every check-in. Discrepancies between reported location and actual location are flagged automatically. GPS verification reduces fake visits by 85-95% in the first month. Combined with continuous field force tracking, it provides a complete movement trail that makes fabrication practically impossible.
Problem 2: Late Submission
The problem: Salesmen submit DSRs the next morning or, worse, batch-submit multiple days at once. By the time management sees the data, it is too late to act on it. A scheme communication gap reported on Monday's DSR is not read until Wednesday, costing three days of execution.
Solution: Auto-reminders and real-time capture. In a digital DSR, data flows in real time, so "submission" is not a separate step. The DSR builds itself throughout the day as the salesman works. For managers who still want a formal end-of-day submission, automated reminders push notifications at a configurable time (e.g., 5:30 PM). Salesmen who have not completed their DSR by the cutoff time are flagged on the manager's dashboard. Repeated late submissions trigger escalation to the area sales manager.
Problem 3: Incomplete Data
The problem: Salesmen skip fields they consider unimportant. Collections are left blank. Remarks say "OK" for every outlet. Returns are not recorded. The DSR technically exists, but half its value is missing because half the fields are empty or perfunctory.
Solution: Mandatory fields and validation rules. In a digital DSR, critical fields are marked mandatory: the salesman cannot check out of an outlet without recording the visit outcome (order, no-order with reason, collection, or return). Validation rules enforce data quality: order values must be positive numbers, collection amounts cannot exceed outstanding balance, and the remarks field requires a minimum character count for no-order visits. These constraints are impossible to enforce on paper but trivial in a mobile app.
Problem 4: Cherry-Picking Outlets
The problem: Salesmen visit easy outlets (high-relationship, guaranteed orders) and skip difficult ones (new outlets, credit-hold retailers, outlets with complaints). Over time, this creates coverage gaps where entire segments of the retail universe are under-serviced. The DSR may show high productive call rates, but only because the salesman is visiting a self-selected subset of friendly outlets.
Solution: Beat enforcement with deviation alerts. The digital DSR ties to a structured beat plan that defines which outlets must be visited on which days. If the salesman skips a planned outlet, the system generates a deviation alert. Repeated deviations trigger manager notifications. Beat adherence percentage becomes a KPI that is reviewed daily and tied to incentives. Some companies go further by requiring salesmen to provide a reason (selected from a predefined list) for every planned outlet they skip, creating accountability without micromanagement.
DSR Best Practices for Field Sales Managers
Collecting DSR data is necessary but not sufficient. The data must be reviewed, acted upon, and fed back into the field operation in a structured cadence. Here are the best practices that separate high-performing FMCG sales teams from the rest.
Daily Review Cadence
Every evening or first thing in the morning, the area sales manager reviews the previous day's DSR data across all salesmen. This is not a 30-minute analytical deep dive. It is a 10-minute scan looking for exceptions: who missed their beat? Whose strike rate dropped below 50%? Who had zero collections? Which outlets reported competitor activity? The daily review catches problems within 24 hours instead of letting them fester until the monthly review. Use the analytics dashboard to sort by exception rather than reviewing every salesman sequentially.
Weekly Coaching Sessions
Once a week, the area sales manager conducts individual or small-group coaching sessions using DSR data. The coaching is specific and evidence-based: "Your productive call rate dropped from 72% to 58% this week. Let us look at which outlets went unproductive and why." DSR data transforms coaching from subjective opinion ("You need to work harder") into objective, data-driven feedback ("Your lines per call on Beat C are 3.2 versus the team average of 5.1. Let us work on range selling for that beat"). Weekly coaching based on DSR data is the single most impactful management practice in FMCG field sales.
Monthly Performance Reviews
Monthly reviews aggregate DSR data into performance scorecards for each salesman. The scorecard includes all seven KPIs discussed earlier: productive call percentage, strike rate, average order value, lines per call, beat adherence, collection efficiency, and new outlet conversion rate. Trends over the past 3-6 months reveal whether a salesman is improving, plateauing, or declining. Monthly reviews also compare salesman performance within a territory and across territories, enabling best-practice sharing from top performers to underperformers. For a structured approach to improving sales productivity, monthly DSR reviews are indispensable.
Incentive Alignment With DSR KPIs
If salesmen are incentivized purely on order value, they will optimize for order value at the expense of everything else: skipping low-value outlets, ignoring collections, avoiding new outlet development. The most effective FMCG incentive structures weight multiple DSR-derived KPIs. A balanced incentive model might allocate 40% weight to order value achievement, 20% to productive call percentage, 15% to beat adherence, 15% to collection efficiency, and 10% to new outlet additions. When the incentive structure aligns with the DSR KPIs that management tracks, the salesman's daily behavior naturally aligns with organizational objectives.
Quarterly Beat Restructuring
Every quarter, use aggregated DSR data to evaluate and restructure beats. Which beats consistently underperform? Are some beats too large (high outlet count with low coverage) while others are too small (salesman returns by 2 PM with nothing to do)? DSR data reveals the answers. Beat restructuring based on three months of DSR data is far more effective than the initial beat design, which was based on assumptions. Use distribution tracking data alongside DSR insights to identify coverage gaps and rebalance territories.
Competitive Intelligence Aggregation
The remarks field in DSRs contains competitive intelligence that is almost never aggregated systematically. When 50 salesmen each report two competitor observations per day, that is 100 daily data points on competitor pricing, promotions, new launches, and distribution expansion. Aggregating this data weekly and routing it to the brand team creates a low-cost, high-frequency competitive intelligence system. Digital DSR systems with structured competitor feedback fields make this aggregation automatic rather than manual.
Ready to eliminate paper DSRs and unlock real-time field intelligence? SpireStock's mobile DMS auto-generates Daily Sales Reports from actual field activity, with GPS verification, real-time dashboards, and automated KPI tracking. Book a free demo or explore our pricing plans to see how your field team can achieve 25-35% higher productivity within the first quarter.
Sources & References
- IBEF, India Brand Equity Foundation, FMCG Industry Report
- Nielsen IQ, NielsenIQ India Retail Intelligence
- FICCI, Federation of Indian Chambers of Commerce and Industry, FMCG Sector
Frequently Asked Questions
DSR stands for Daily Sales Report. It is a daily field activity report submitted by FMCG salesmen that captures outlets visited, orders taken, collections made, returns processed, new outlets added, and competitor observations. The DSR is the primary source of secondary sales data and field intelligence for FMCG distribution management.
The 10 essential fields are: date, salesman name and code, beat or route name, outlets planned vs visited, productive calls (orders taken), total order value, collections, returns and damage, new outlets added, and remarks with competitor information. These fields balance completeness with practicality for daily use.
Productive call percentage is calculated as (number of outlets where orders were taken divided by total outlets visited) multiplied by 100. For Indian FMCG operations, a benchmark of 60-75% is considered good for established territories, while 40-55% is typical for new territories under development.
Productive call percentage uses outlets visited as the denominator, while strike rate uses outlets planned. This means strike rate penalizes salesmen who skip difficult outlets and cherry-pick easy ones. A salesman who visits 15 of 20 planned outlets and gets 12 orders has a productive call rate of 80% but a strike rate of 60%.
Paper-based DSRs cannot reliably prevent fake entries. The solution is digital DSR with GPS-verified check-ins. Mobile DMS apps require the salesman to check in within a geo-fenced radius of the outlet, recording GPS coordinates and timestamps automatically. GPS verification reduces fake visits by 85-95% in the first month of deployment.
For mature Indian FMCG operations, 85-95% beat adherence is the target range. Below 80% indicates weak beat discipline requiring immediate managerial attention. GPS-enabled digital DSR systems have improved average beat adherence from 65% in paper-based systems to 88% in digital systems across Indian FMCG distributors.
Digital DSR improves productivity through real-time data flow, GPS verification eliminating fake visits, auto-calculated metrics removing manual errors, and instant analytics enabling same-day corrective action. Companies transitioning from paper to digital DSR consistently report 20-35% improvement in field productivity within the first quarter.
Yes. When aggregated across hundreds of salesmen and thousands of outlets, DSR data reveals demand patterns at the SKU, outlet, and territory level. Secondary sales data captured in DSRs feeds demand forecasting models, enabling better production planning, inventory optimization, and scheme design. DSR data is the primary source of bottom-up demand signals in FMCG distribution.
Related SpireStock Features
Powerful dashboards with sales trends, MIS reports, and distribution analytics.
Geo-tagged attendance with location verification and travel analytics.
Mobile app for distributors, retailers, and delivery teams.
Real-time GPS tracking of vehicles and drivers with route optimization for faster deliveries.
End-to-end order lifecycle from placement to delivery with multi-level approval workflows.
Related Industries
Related Solutions
Boost field sales team productivity with beat planning, GPS attendance, order capture, and performance analytics. Built for Indian FMCG teams.
Track and manage your retail network. Geo-tag outlets, capture secondary sales, manage beats, and monitor retailer performance. Try SpireStock.
Related Entities
Ready to Streamline Your Distribution?
Start your free 30-day trial and see how SpireStock can transform your dairy, FMCG or consumer-goods distribution operation, from order capture to crate recovery.
SpireStock Team
Distribution Technology Experts
SpireStock Team writes for SpireStock on distribution management, supply-chain optimisation and field operations for Indian dairy and FMCG brands.


