The Uncomfortable Truth: Excel Is Still King of Indian Distribution
Walk into any FMCG distributor's office in India, from a Rs 5 crore regional player to a Rs 100 crore multi-brand operator, and you'll find Excel. It tracks orders, manages inventory, calculates schemes, records payments, plans routes, and generates reports. A 2024 survey by the Confederation of Indian Industry (CII) found that 62% of Indian FMCG distributors with turnover under Rs 50 crore use Microsoft Excel or Google Sheets as their primary operational tool. Not Tally (that handles only accounting). Not a DMS. Excel.
This isn't because distributors are technologically backward. It's because Excel genuinely works, up to a point. This article is not an arrogant dismissal of Excel. It's an honest, data-driven examination of where Excel breaks down in FMCG distribution, what that breakdown costs in rupees, and how to migrate to purpose-built software when you're ready. If you manage distribution operations and suspect Excel is holding you back, this analysis will give you the numbers to make the case to your management. For an overview of what modern distribution software offers, start with our What Is DMS explainer.
Why Distributors Love Excel: The Honest Reasons
Before quantifying the costs, let's acknowledge why Excel persists. Understanding these reasons is essential for designing a migration that sticks:
- Zero licence cost: Excel comes bundled with the Windows/Office subscription most businesses already pay for. Google Sheets is free. A DMS costs Rs 200-800 per user per month.
- Zero onboarding: Everyone knows how to use a spreadsheet. A new hire can start entering data on Day 1. A DMS requires 1-3 weeks of training.
- Infinite flexibility: Need a new column? Add it. Need a new formula? Write it. Need a new sheet? Create it. No support tickets, no feature requests, no waiting for the next release.
- Familiarity breeds comfort: The distributor principal has used Excel for 15 years. His key staff know the templates intimately. Switching means learning something new, and people resist change.
- Low perceived risk: "Excel works. Why fix what isn't broken?" This logic holds until it doesn't, usually when the business hits a scaling wall.
The Excel Audit: Quantifying What It Actually Costs
Let's audit Excel's true cost for a representative Indian FMCG distributor: 300 retailers, 8 salesmen, 150-200 orders per day, 500 SKUs, 5 active trade schemes. We'll calculate costs across five dimensions.
1. Time Wasted on Manual Data Entry
Every order that comes in via phone call or WhatsApp must be manually typed into the Excel order sheet. With 175 orders/day averaging 6 line items each, that's 1,050 line items entered by hand.
- Average time per line item entry: 45 seconds (including product lookup, quantity, scheme check)
- Total daily entry time: 1,050 × 45 sec = 13.1 hours
- Staff required: 2 full-time data entry operators
- Monthly cost at Rs 18,000/person: Rs 36,000
A DMS with mobile ordering reduces this to near-zero, retailers or salesmen enter orders directly in the app, and the data flows into the system without re-entry.
2. Error Rates and Their Cost
Research published in the Journal of End User Computing found that 88% of complex spreadsheets contain at least one error (Panko & Halverson, 2006). For distribution operations, the common errors are:
| Error Type | Frequency (per month) | Avg. Cost Per Error (INR) | Monthly Cost (INR) |
|---|---|---|---|
| Scheme miscalculation (wrong slab, expired scheme applied) | 25-40 | Rs 1,200 | Rs 30,000-48,000 |
| Pricing error (old rate not updated) | 15-25 | Rs 800 | Rs 12,000-20,000 |
| Quantity error (typo in order entry) | 30-50 | Rs 500 | Rs 15,000-25,000 |
| GST rate error (wrong rate on mixed invoice) | 10-20 | Rs 1,500 | Rs 15,000-30,000 |
| Crate count mismatch (no real-time tracking) | 40-60 | Rs 300 | Rs 12,000-18,000 |
| Payment allocation error | 10-15 | Rs 2,000 | Rs 20,000-30,000 |
Total monthly error cost: Rs 1,04,000-1,71,000. These are not theoretical numbers, they represent real credit notes issued, goods returned, crates lost, and hours spent resolving disputes that wouldn't exist in a system with built-in validation rules.
3. The Scaling Ceiling
Excel works tolerably for one person managing one sheet. It breaks catastrophically when multiple people need simultaneous access to the same data. Consider what happens when your distributor grows from 300 to 600 retailers:
- Order volume doubles, but data entry capacity doesn't, you need to hire 2 more operators
- File size grows to 50-100 MB, causing slowdowns, crashes, and corruption
- Version control collapses, "Which is the latest file? OrderMaster_v3_final_FINAL2.xlsx?"
- Formula interdependencies become fragile, one accidental edit can break downstream calculations across 15 linked sheets
- Reporting takes hours instead of seconds, pivot tables on 100K+ rows freeze Excel regularly
The cost of the scaling ceiling isn't in the spreadsheet, it's in the business you can't take on, the brands you can't onboard, and the territories you can't expand into because your operational backbone can't handle the load.
4. Real Examples of Excel Failures
Scheme Miscalculation: A distributor in Pune running a "Buy 10, Get 1 Free" scheme on a popular curd brand used an Excel formula to calculate free units. The formula referenced a cell range that didn't expand when new retailers were added at the bottom of the sheet. Result: 47 retailers received the scheme; 23 recently-added retailers didn't. The distributor discovered the error only when retailers complained, after 3 weeks. Cost: Rs 68,000 in retrospective credit notes plus significant retailer goodwill damage. A scheme management engine applies schemes automatically based on configurable rules, eliminating formula-based errors entirely.
Crate Loss: A dairy distributor in Gujarat tracked crate issuance and returns in an Excel sheet updated by delivery drivers at the end of each day. Drivers routinely forgot to log returns, leading to a phantom crate deficit of 1,200 units over 6 months. At Rs 180 per crate, that's Rs 2.16 lakh in unexplained losses. When audited, it turned out 800 crates had been returned but never recorded. The remaining 400 were genuinely lost. A digital crate management system with real-time OTP-verified transactions would have caught discrepancies within hours, not months.
Delivery Dispute: A distributor in Mumbai couldn't prove delivery of Rs 45,000 worth of goods to a retailer who claimed non-receipt. The Excel delivery log showed the entry, but the retailer argued it was fabricated after the fact. Without GPS-stamped, OTP-verified digital proof of delivery, the distributor had to absorb the loss. Modern DMS platforms capture delivery confirmation with timestamp, GPS location, OTP verification, and even photographs, creating evidence that settles disputes instantly.
5. Opportunity Cost: What You Can't Do with Excel
The hardest cost to quantify is the opportunities Excel prevents you from pursuing:
- Real-time inventory visibility: Brands increasingly demand real-time secondary sales data from distributors. Excel-based reporting is always delayed by 1-3 days, making you less competitive versus digitized distributors.
- Data-driven territory planning: Without clean, structured sales data, you can't identify under-penetrated areas, optimize beat plans, or benchmark salesman performance objectively.
- Brand partnerships: Large FMCG brands are increasingly mandating DMS adoption as a prerequisite for distributorship renewal. If your competition adopts a DMS and you don't, you risk losing premium brand partnerships.
- Scheme ROI analysis: With Excel, you know how much you spent on schemes but not which schemes actually drove incremental sales. Purpose-built analytics dashboards track scheme-level ROI automatically.
Total Cost of Excel: The Full Picture
| Cost Category | Monthly Cost (INR) | Annual Cost (INR) |
|---|---|---|
| Manual data entry staff | Rs 36,000 | Rs 4,32,000 |
| Error-related losses | Rs 1,04,000-1,71,000 | Rs 12,48,000-20,52,000 |
| Crate losses (untracked) | Rs 18,000-36,000 | Rs 2,16,000-4,32,000 |
| Delivery disputes (unproven) | Rs 15,000-30,000 | Rs 1,80,000-3,60,000 |
| Management time on reconciliation | Rs 25,000-40,000 | Rs 3,00,000-4,80,000 |
| Total quantifiable cost | Rs 1,98,000-3,13,000 | Rs 23,76,000-37,56,000 |
A mid-sized FMCG distributor is losing Rs 24-38 lakh per year to Excel-related inefficiencies. A purpose-built DMS for the same operation typically costs Rs 4-8 lakh per year (depending on user count and modules). The ROI is 3-8x, and that's before counting the unquantifiable opportunity costs of limited scalability and delayed reporting.
The 6-Step Migration Roadmap: Excel to DMS
If the numbers above resonate with your experience, here's a practical migration plan that minimizes disruption:
Step 1: Audit Your Current Excel Ecosystem (Week 1-2)
Document every Excel file in your operation: order sheets, billing templates, inventory trackers, scheme calculators, route plans, payment ledgers, crate registers. Map the data flow between them. Identify which files are critical (daily use by multiple people) and which are peripheral. This audit typically reveals 15-25 active spreadsheets that form the operational backbone.
Step 2: Prioritize by Pain (Week 2-3)
Rank your Excel files by how much pain they cause. Typically, the order entry sheet and billing template are the highest-pain files because they're used most frequently, by the most people, with the highest error consequences. Start your migration with these. Don't try to replace everything at once.
Step 3: Choose the Right DMS (Week 3-5)
Evaluate 3-4 distribution management platforms against your specific requirements. Use the 10-criteria SFA evaluation checklist as a starting framework. Insist on a paid pilot (not just a demo) with your actual data. Check our complete DMS guide for evaluation criteria.
Step 4: Migrate Data (Week 5-7)
Clean your Excel data before migrating. This is the most painful step because it exposes years of accumulated data quality issues, duplicate retailers, inconsistent product names, missing GSTINs, incorrect outstanding balances. Budget 2-3 weeks for data cleaning and migration. Your DMS vendor should provide migration tools and support.
Step 5: Parallel Run (Week 7-9)
Run both systems simultaneously for 2 weeks. Every order goes into Excel AND the DMS. Every invoice is generated in both. At the end of each day, reconcile the two. This parallel run builds confidence, catches configuration errors, and gives staff time to learn the new system without the pressure of it being the only system.
Step 6: Cut Over and Excel Retirement (Week 9-10)
On the designated cutover date, Excel becomes read-only (for historical reference) and all operations move to the DMS. This should be a firm, announced decision, not a gradual drift. Gradual migrations fail because people default to the familiar tool under pressure. Archive Excel files, remove edit access, and make the DMS the single source of truth.
What Doesn't Change When You Migrate
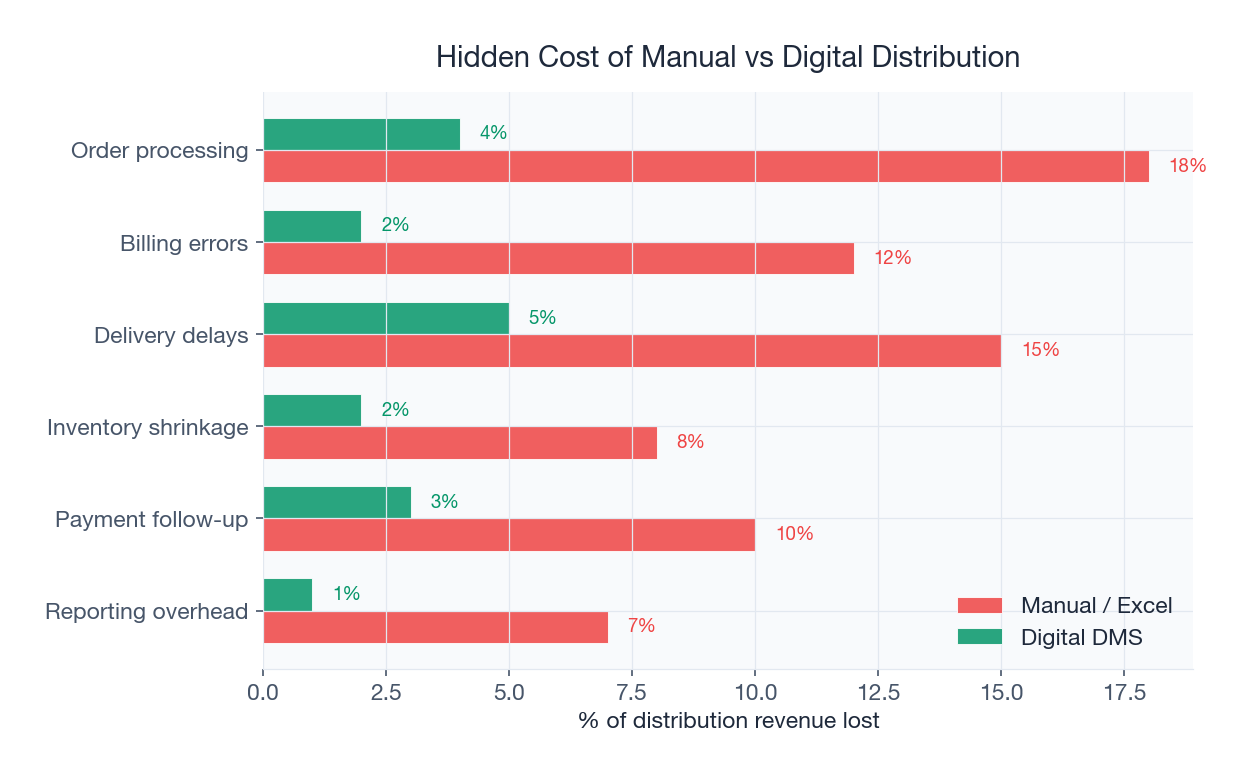
A common fear is that "everything will change." In reality, the core workflow stays the same. Retailers still place orders (now via app instead of WhatsApp/phone). Salesmen still visit outlets (now with GPS tracking). Invoices still go to Tally (now via automated sync instead of manual entry). Reports still come to the boss (now in real-time instead of after 3 days of Excel assembly). The DMS replaces the tool, not the process. For a comparison of manual vs digital distribution workflows, read our detailed comparison.
When to Stay on Excel
Honesty compels us to acknowledge that Excel is genuinely sufficient for some operations:
- Fewer than 50 retailers with a single brand and no trade schemes
- Owner-operator businesses where one person controls all data entry
- Businesses not required to share real-time data with brand principals
- Operations with no plans to grow beyond current scale in the next 3 years
If all four conditions apply, the investment in a DMS may not yield sufficient returns. For everyone else, the Excel tax is real and growing.
Conclusion
Excel isn't evil, it's inadequate. It served Indian FMCG distribution well in an era of smaller operations, fewer SKUs, simpler schemes, and no GST. That era is over. Today's distribution environment demands real-time data, automated compliance, multi-user access, and scalability that spreadsheets cannot provide. The Rs 24-38 lakh annual cost of Excel-based distribution is not a technology problem, it's a business problem disguised as a technology choice. The 6-step migration roadmap above provides a low-risk path from Excel to purpose-built distribution software, preserving what works while eliminating what doesn't. When you're ready to explore the transition, get in touch for a free Excel-vs-DMS cost comparison tailored to your operation. Also explore our 2026 FMCG distribution challenges analysis and secondary sales tracking guide for additional context.
Sources & References
Frequently Asked Questions
Indian FMCG distributors persist with Excel for five reasons: zero licence cost (bundled with Office/free via Google Sheets), zero onboarding time (everyone knows spreadsheets), infinite flexibility (add columns and formulas at will), deep familiarity (15+ years of habit), and low perceived risk ('why fix what works'). These advantages are real, but they mask significant hidden costs.
A mid-sized FMCG distributor (300 retailers, 8 salesmen, 175 orders/day) loses Rs 24-38 lakh per year to Excel-related inefficiencies: Rs 4.3 lakh in data entry staff, Rs 12.5-20.5 lakh in error-related losses, Rs 2.2-4.3 lakh in untracked crate losses, Rs 1.8-3.6 lakh in delivery disputes, and Rs 3-4.8 lakh in management reconciliation time. A DMS costs Rs 4-8 lakh/year for the same operation.
The six most common errors are: scheme miscalculation (wrong slab or expired scheme applied via broken formulas), pricing errors (old rates not updated across all sheets), quantity typos in order entry, GST rate errors on mixed-rate invoices, crate count mismatches from delayed manual logging, and payment allocation errors. Together, these cost Rs 1-1.7 lakh per month for a mid-sized distributor.
A well-planned Excel-to-DMS migration takes 9-10 weeks: 2 weeks for auditing your current Excel ecosystem, 1 week for pain prioritization, 2 weeks for DMS evaluation and selection, 2-3 weeks for data cleaning and migration, 2 weeks for parallel run (both systems simultaneously), and a firm cutover date. The biggest time sink is data cleaning, years of accumulated data quality issues surface during migration.
Excel works adequately for distributors with fewer than 50 retailers, a single brand, no trade schemes, where one person controls all data entry, real-time reporting isn't required by brand principals, and there are no growth plans for the next 3 years. If all conditions apply, DMS investment may not yield sufficient ROI. For everyone else, the hidden cost of Excel exceeds the cost of distribution software.
The typical ROI is 3-8x in the first year. A DMS costing Rs 4-8 lakh/year eliminates Rs 24-38 lakh in quantifiable Excel-related losses (data entry staff, errors, crate losses, disputes, reconciliation time). Additionally, distributors gain unquantifiable benefits: real-time reporting, brand compliance, scalability, and data-driven decision making. Most distributors achieve positive ROI within 3-4 months of go-live.
Related SpireStock Features
Related Industries
Related Solutions
Manage your entire distributor network digitally. Onboarding, credit limits, outstanding tracking, and performance analytics. Start free trial.
Boost field sales team productivity with beat planning, GPS attendance, order capture, and performance analytics. Built for Indian FMCG teams.
Related Entities
Ready to Streamline Your Distribution?
Start your free 30-day trial and see how SpireStock can transform your dairy, FMCG or consumer-goods distribution operation, from order capture to crate recovery.
SpireStock Team
Distribution Technology Experts
SpireStock Team writes for SpireStock on distribution management, supply-chain optimisation and field operations for Indian dairy and FMCG brands.


