Why Festive Season Makes or Breaks FMCG Distributors
If you run FMCG distribution in India, the September-December festive window is not just another quarter. It is the quarter. Across categories from sweets and snacks to personal care and home cleaning, the festive season routinely accounts for 30-40% of annual revenue. For gifting packs, dry fruits, and premium chocolates, the concentration is even more extreme: 50-60% of yearly sales happen in these four months.
The numbers are staggering. India's FMCG market crosses Rs 6 lakh crore annually, which means the festive season drives Rs 1.8-2.4 lakh crore in distribution value every year. Production facilities ramp up 20-40% starting in July. Temporary warehousing demand surges. Delivery fleets stretch to capacity. And every single distributor, from a regional dairy operator to a national snacks brand covering 500 towns, faces the same existential question: will we have enough stock in the right place at the right time?
The cost of getting this wrong is brutal. One major FMCG company estimated Rs 120 crore in lost sales due to festive stockouts in a single year. That was not a supply problem; production had been ramped up well in advance. It was a distribution problem. Stock was sitting in the wrong warehouses, allocated to the wrong territories, with schemes that did not reach the right retailers at the right time. The production team had done their job. The distribution network had failed.
On the other side, over-ordering creates its own disaster: unsold festive packs with dated packaging, perishable products past their prime, and scheme-linked inventory that cannot be returned without complex settlements. For dairy distributors, the margin for error is even thinner because products expire in days, not months.
The difference between brands that consistently win during festive season and those that scramble is not luck or brand strength. It is planning. Specifically, it is a disciplined 90-day countdown that begins in July, not September. This guide provides the complete checklist, organized by timeline, with specific actions, metrics, and tools for each phase.
The Indian Festive Calendar for FMCG
Each festival drives different categories, geographies, and consumer behaviors. Treating the festive season as a single block is one of the most common and costly planning mistakes.
Ganesh Chaturthi (August-September): The festive season opener, primarily impacting Maharashtra, Karnataka, and South India. Dairy demand (milk, paneer) surges 25-30% in Mumbai and Pune alone. This is the window for launching festive SKUs and gift packs.
Navratri and Dussehra (September-October): Fasting-specific products like sabudana, kuttu ka atta, and sendha namak see 3-5x demand spikes in Gujarat and North India. Simultaneously, Durga Puja in West Bengal creates a parallel demand wave for sweets and personal care.
Karva Chauth (October): A focused, one-day festival in North India driving sharp spikes in sargi items, sweets, and dry fruits. The demand window is narrow (3-5 days), making precise stock positioning critical.
Diwali and Bhai Dooj (October-November): The undisputed peak. Diwali alone can account for 15-20% of annual FMCG sales. The Dhanteras-to-Bhai Dooj window of approximately 7 days is the single most critical week in Indian FMCG distribution.
Christmas and New Year (December): While Christmas is concentrated in Goa, Kerala, and the Northeast, New Year drives nationwide demand for premium products and party supplies. Many brands push clearance schemes to move remaining festive inventory.
Category-Wise Demand Uplift
- Sweets and Namkeen: 3-5x during Diwali, 2-3x during Navratri
- Dairy (Milk, Paneer, Ghee): 25-40% uplift from Navratri through Diwali
- Dry Fruits and Chocolates: 4-6x during the Diwali gifting window
- Home Cleaning Products: 2-3x in the 2-3 weeks before Diwali
- Personal Care: 1.5-2x during Navratri and Karva Chauth, sustained through Diwali
- Premium and Gifting SKUs: 5-8x in the Dhanteras-to-Bhai Dooj window
These demand spikes are not uniform across India. A distributor in Gujarat needs a completely different festive plan than one in West Bengal. Sales analytics platforms that provide territory-level, festival-level historical data are indispensable for this mapping.
T-90 Days: Strategic Planning (July)
The 90-day countdown begins in July. Mistakes made in the strategic planning phase compound through the entire festive season.
Demand Forecasting from Prior Years
Start with at least three years of historical festive season data. Pull secondary sales data at the SKU-territory level for August through December. Do not use primary sales data; primary sales include channel stuffing that distorts the picture. Secondary sales from your distribution tracking system reflect actual consumer demand.
For each SKU-territory combination, calculate the festive uplift factor: the ratio of festive period sales to extrapolated non-festive trends. A product growing at 15% annually will show higher absolute festive sales each year, but the uplift factor (say, 2.3x) may be stable. It is the uplift factor, not the absolute number, that you should use for forecasting. Adjust for new SKU launches, territory changes, pricing revisions, and competitive shifts.
Budget Allocation and Scheme Design
Allocate your festive budget across three buckets: incremental inventory investment (50%), scheme and promotion budget (30%), and operational expansion (20%). July is the time to design festive schemes, not September. Rushing scheme design in September leads to poorly structured offers that bleed margins or fail to motivate the trade. Design schemes using the scheme management framework and review our guide on preventing scheme leakage in FMCG before finalizing.
Temporary Warehouse Identification
If your forecast indicates 20-40% more stock, existing warehouse capacity may not suffice. In major hubs like Mumbai, Delhi, and Ahmedabad, temporary warehouse availability tightens dramatically from August onward as every FMCG company competes for the same spaces. Early movers get better locations at better rates.
Evaluate temporary warehouses on proximity to your key retail clusters, cold storage capability if you distribute dairy or perishables, loading dock capacity for increased dispatch volumes, and connectivity to your primary transportation routes. Your route optimization engine can model the impact of a temporary warehouse location on overall delivery efficiency before you commit to a lease.
T-60 Days: Preparation (August)
August shifts focus from planning to building capacity: stock, staff, fleet, and retailer readiness.
Stock Pre-Loading
Begin the first wave by pushing 40-50% of incremental festive stock to distributors, focusing on high-velocity SKUs and longer shelf-life products. Reserve the remaining 50-60% for September when fresher demand signals are available. Many smaller distributors may lack working capital or space for sudden inventory surges, so offer pre-loading incentives: early payment discounts, extended credit terms, or guaranteed return policies. Track progress through your order management system.
Temporary Staff and Fleet Expansion
The festive season typically requires 15-25% additional field staff. Allocate at least 5-7 days for training covering the mobile app, scheme eligibility rules, delivery verification, and return handling. For delivery fleet, assess capacity against the demand forecast. For dairy distribution, refrigerated vehicle availability must be locked in by mid-August. Model the expanded fleet in your route optimization system before the first day of increased dispatch.
Retailer Communication
August is when you begin structured retailer communication about the upcoming festive season. This is not a generic circular. It is a specific communication that covers your festive product range and any new festive SKUs, the scheme calendar with activation and end dates for each offer, any changes to delivery frequency or beat schedules during festive months, the pre-order window for high-demand items, and the process for placing festive orders through your app or salesman.
Effective retailer communication in August sets expectations and reduces panic ordering in September and October. Use your beat planning system to ensure every retailer in every territory receives this communication through their assigned salesman during a regular beat visit. Retailers who understand the plan in advance place more rational orders and maintain better display compliance during the season.
T-30 Days: Execution Mode (September)
September marks the shift to execution. Ganesh Chaturthi is underway, Navratri is approaching, and the festive machine must be running smoothly.
Final Stock Push and Scheme Activation
Complete the remaining stock push, informed by updated demand signals from Ganesh Chaturthi performance. Monitor distributor stock levels daily. A distributor at 25 days of inventory for a 30-day shelf-life product is a ticking time bomb. One at only 5 days of inventory for a product forecasted to see 3x demand is equally dangerous. Distribution tracking dashboards showing real-time days-of-cover by distributor and SKU are essential.
Activate the first round of festive schemes. Timing is critical: activate trade schemes 7-10 days before the target festival and consumer schemes 3-5 days before. Ensure every scheme is properly configured in your scheme engine with automatic eligibility calculation and real-time tracking. Review scheme leakage prevention strategies before activation.
Beat Intensification and Merchandising
Increase beat frequency for high-priority outlets. During normal months, a retailer might receive one visit per week; during festive season, top outlets may need 2-3 visits weekly to ensure stock availability, display compliance, and order capture. Redesign beat plans for September-November with increased frequency for A-class and B-class outlets while maintaining minimum coverage for C-class outlets.
Beat intensification requires clear prioritization. You cannot increase frequency for every outlet; you do not have enough feet on the street. Use sales analytics data to rank outlets by festive season contribution and focus additional capacity on the 20% of outlets generating 70-80% of festive revenue.
Deploy festive displays, shelf talkers, and point-of-sale materials simultaneously with scheme activation. In-store visibility during festive season directly drives impulse purchases. For gifting categories, a well-placed display can increase sales 3-5x compared to regular shelf placement. Track display compliance through your field force app and set it as a daily KPI for field staff during the festive period.
During Festive Season (October-November)
October and November are the heart of festive season. This is not the time for strategy. This is the time for execution, monitoring, and rapid response.
Daily Monitoring Rhythm
Switch from weekly reviews to daily monitoring. Every morning, review four metrics: yesterday's secondary sales versus target by territory, current stock days-of-cover by distributor and SKU, scheme redemption rates versus budget, and beat compliance percentage. SpireStock's sales analytics dashboard provides these in real time with automated alerts. During Diwali week, some clients review dashboards three times daily. When a single week generates 15-20% of annual revenue, missing a problem for even 12 hours is enormously costly.
Stock Redistribution
No forecast is perfect. During the festive season, demand patterns shift daily. A territory tracking 10% below forecast on October 5 might suddenly surge after a competitor goes out of stock. A distributor sitting on excess inventory might see a nearby market event create unexpected demand. Real-time stock redistribution, moving inventory from overstocked distributors to understocked ones, is the single most valuable operational capability during festive season.
Build redistribution protocols before the season starts. Define the triggers: what level of overstock or understock justifies action? Define the logistics: who arranges the transfer and who bears the cost? Define the authority: who can approve a redistribution without waiting for a senior leadership meeting? During Diwali week, you cannot afford a 48-hour approval cycle for moving 500 cases from Ahmedabad to Surat. Use distribution tracking to identify redistribution opportunities in real time.
Real-Time Scheme Tracking
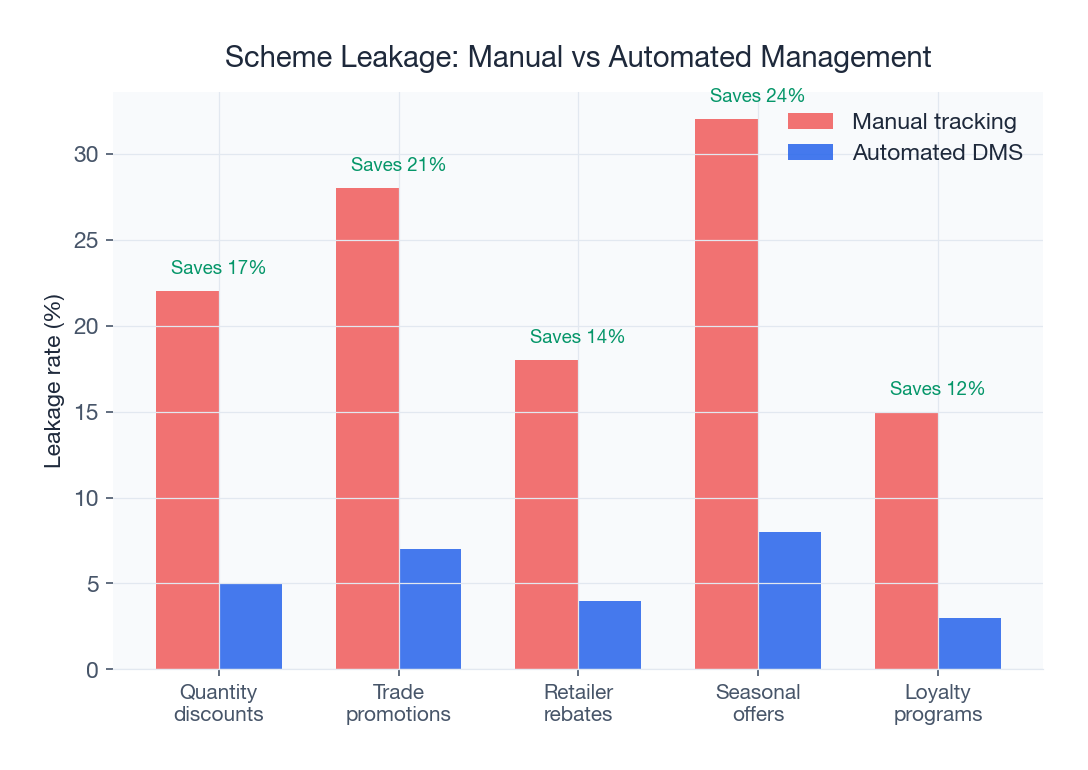
Festive schemes are your biggest variable cost during this period. Without real-time tracking, you have no idea whether your Rs 50 lakh Diwali scheme budget is being spent effectively or leaking through ineligible claims, duplicate redemptions, or phantom retailers. Monitor scheme utilization daily against budget. If a scheme is burning through its budget 40% faster than planned, either demand is higher than expected or leakage is occurring, and both scenarios need immediate investigation.
Your scheme engine should provide real-time dashboards showing scheme-wise utilization, territory-wise distribution of claims, and flagged transactions that deviate from expected patterns. Comprehensive guidance is available in our scheme leakage prevention guide.
Beat Compliance and Competitor Intelligence
Festive season tempts field staff to cherry-pick high-value outlets and skip smaller ones. Enforce beat compliance at 90%+ using GPS-tracked attendance and visit verification. The C-class kirana store skipped during Diwali week remembers being ignored when your competitor shows up in December.
Your field force should capture competitor intelligence at every visit: what schemes are competitors running, what displays have they deployed, which new products have appeared. Aggregate daily. If a competitor launches an aggressive scheme in a key territory, you need to know within 24 hours, not at the next monthly review.
Post-Festive Season (December)
The post-festive phase is critical for financial health, retailer relationships, and learning that improves next year.
Returns and Unsold Stock
Define clear return windows for retailers and distributors. Process returns through your order management system to maintain accurate inventory and ensure prompt credit notes. Delays in return processing are the number one source of distributor frustration after festive season. For stock that cannot be returned, execute a liquidation strategy: deeper modern trade discounts, bundled offers, or institutional sales. For dairy distributors, daily stock aging monitoring in the first two weeks of December is essential to minimize write-offs.
Scheme Settlement
Festive scheme settlements should be completed by mid-December at the latest. Every day of delayed settlement erodes distributor trust. Reconcile scheme claims against actual sales data, resolve disputes quickly, and issue payments or credits on a defined schedule. Use your scheme management platform to automate reconciliation and flag discrepancies for manual review rather than manually checking every claim.
Common settlement issues include claims for products not in the scheme catalog, claims exceeding the purchased quantity, duplicate claims from the same outlet, and claims from outlets not in the distributor's territory. An automated scheme engine catches most of these at the point of claim submission. Manual systems catch them weeks later, creating acrimony and financial disputes that poison relationships heading into the new year.
Performance Analysis and Lessons Learned
Before the festive season data becomes stale, conduct a thorough post-festive review. Compare actual performance against the July forecast for every SKU-territory combination. Identify the biggest positive and negative variances. Understand why: was the forecast wrong, was the execution wrong, or did external factors intervene?
Document lessons in three categories. First, forecasting lessons: where was the forecast materially wrong and what methodology would have improved it? Second, execution lessons: where did the distribution machine break down and what capacity changes are needed? Third, scheme lessons: which schemes delivered strong ROI and which were ineffective? Pull comprehensive reports from your sales analytics platform covering secondary sales achievement, OTIF rates, scheme ROI, and beat compliance throughout the festive period. This documentation becomes the starting input for next year's T-90 planning cycle.
Demand Forecasting for Festive Season
Demand forecasting is the most technically challenging aspect of festive planning. Get it right, and every downstream activity falls into place.
Historical Trend Analysis
The simplest approach, and still the most widely used among Indian FMCG companies, is historical trend analysis. Take three years of festive secondary sales data, calculate the compound annual growth rate, and project forward. Apply festival-specific uplift factors calculated from historical data. Adjust for known changes like new territories, lost distributors, or pricing revisions.
Historical trend analysis works well for stable categories in stable territories. Its limitations are clear: it cannot account for new product launches, competitive disruptions, macroeconomic shifts, or changing consumer preferences. It also requires clean, consistent historical data, which many distributors lack because they switched DMS platforms or have gaps in secondary sales capture. For brands using modern distribution management software, three years of clean secondary sales data should be readily available.
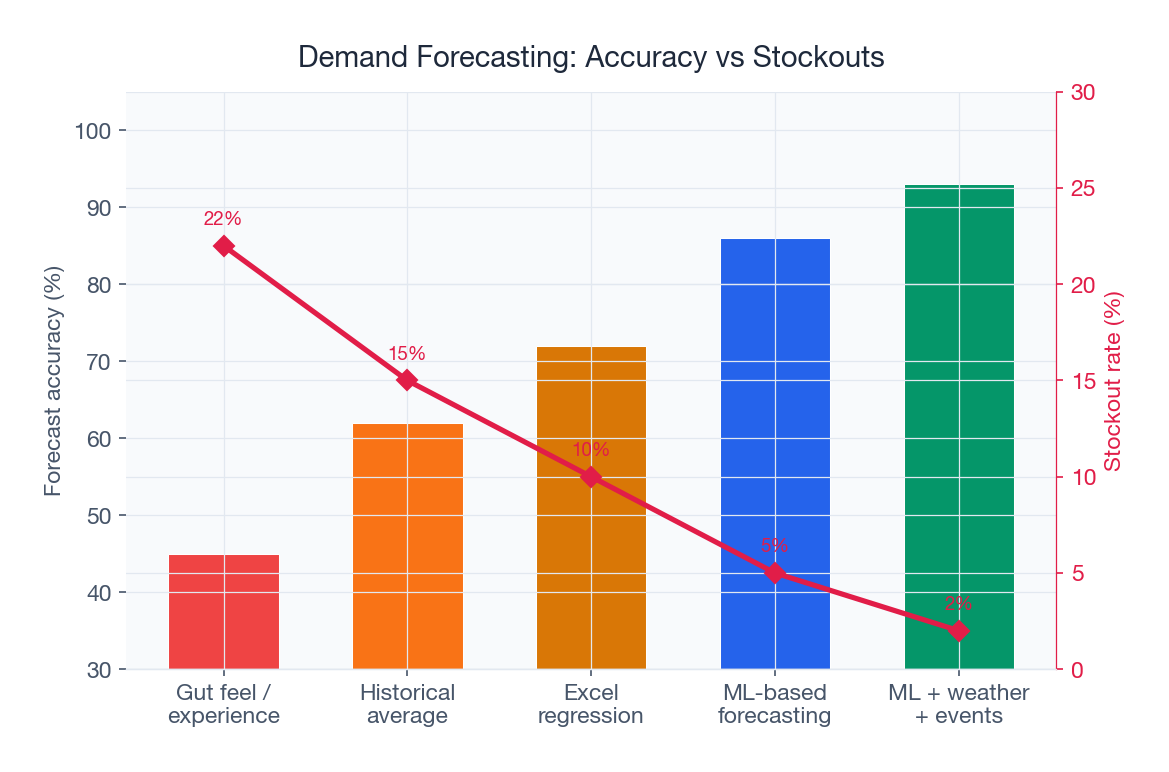
ML-Based Forecasting
Machine learning models can significantly improve festive demand forecasting by incorporating variables that historical analysis ignores. An ML model can factor in day-of-week effects (weekday versus weekend festivals), weather patterns (a cooler-than-normal October boosts certain categories), festival date shifts (Diwali moving between October and November changes demand timing), promotional calendars (your own and competitors' scheme timing), and macroeconomic indicators (consumer confidence and disposable income trends).
The challenge with ML-based forecasting is data quality and model training. You need at least three years of granular data, and it must be consistent and clean. For most mid-size FMCG companies in India, a hybrid approach works best: use historical trend analysis as the baseline and layer ML-based adjustments for specific factors that historical data alone cannot capture.
Avoiding Over-Ordering vs Under-Ordering
The core challenge is asymmetric risk. Under-ordering means permanently lost sales; over-ordering means carrying costs and expiry losses. For most categories, under-ordering costs more, suggesting a slight bias toward higher stock levels. A practical rule: forecast at the 60th percentile of your confidence range rather than the midpoint.
Use phased stock deployment: push 60% initially and hold 40% as a rapid replenishment pool. This lets you redirect stock based on actual early-festive demand signals, reducing both stockout and overstock risk. For perishables with short shelf life, stock closer to the median because unsold inventory costs are much higher.
Scheme Design for Maximum Festive Impact
Well-designed schemes can amplify sales 2-3x beyond organic festive demand. The difference lies in strategic design, not generosity.
Trade Schemes vs Consumer Schemes
Trade schemes target distributors and retailers (buy X get Y free, display compliance incentives). Consumer schemes target end consumers (MRP-off, combo offers, festive gift packs). Trade schemes drive stock loading and are most effective 7-10 days before a festival. Consumer schemes drive pull and work best 3-5 days before. A common allocation is 60% trade and 40% consumer for push-driven categories, and the reverse for pull-driven categories. Your scheme management platform should track both types independently.
Timing and Budget Allocation
Design discrete scheme windows for each festival cluster rather than running a continuous three-month offer. Activate Navratri schemes 7 days before and run through Dussehra. Activate Diwali schemes 10 days before Dhanteras and run through Bhai Dooj. Between windows, maintain only baseline trade incentives. Allocate budget proportionally: typically 55% for Diwali, 15% for Navratri-Dussehra, 10% for minor festivals, and 20% for Christmas-New Year. Track spending daily with automated scheme engines that prevent overspend before it happens.
Case Studies: Brands That Nailed Festive Distribution
Case Study 1: Regional Dairy Brand in Gujarat
A mid-size dairy brand with 85 distributors across Gujarat and Rajasthan was losing Rs 3.5 crore in festive sales annually due to ghee and paneer stockouts during Navratri and Diwali. Phone-based ordering meant stockout information reached supply chain teams 48-72 hours late. During Navratri, when ghee demand spikes 2.5x, a 72-hour stockout means the festival is half over before replenishment arrives.
After implementing real-time distribution tracking with daily stock reporting, the brand built territory-level forecasts, pre-loaded 60% of stock in August, and monitored days-of-cover daily. When an Ahmedabad distributor hit 2 days of ghee cover on Navratri day 3, stock was redistributed from Vadodara within 18 hours. Result: festive stockouts dropped 78%, and festive dairy sales increased by Rs 4.2 crore.
Case Study 2: National Snacks Brand
A snacks brand with pan-India distribution through 400+ distributors was spending Rs 12 crore annually on festive schemes but could not determine whether spending was generating incremental sales or simply subsidizing purchases that would have happened anyway. Scheme settlement was manual, taking 45-60 days post-festive season. Distributors were frustrated by delayed payments, and the brand had no visibility into scheme leakage.
After deploying an automated scheme engine with real-time eligibility checking, automatic claim validation, and daily budget tracking, they discovered 18% of historical claims were ineligible: retailers not meeting purchase thresholds, wrong products, or duplicate claims. Festive scheme spending dropped from Rs 12 crore to Rs 10.2 crore while generating 8% higher incremental sales. Settlement completed within 7 days per festival. The Rs 1.8 crore savings funded additional consumer promotions during Diwali week, further amplifying the festive impact.
Case Study 3: Personal Care Brand in South India
A personal care brand with strong presence in Tamil Nadu, Karnataka, and Kerala faced a different festive challenge: the September-December peak in North India did not align with their primary market's festival calendar. Onam (August-September) and Pongal (January) were their key festivals, but the brand's national planning cycle was geared toward the Navratri-Diwali window. Southern distributors received festive stock allocations that were out of sync with their actual demand peaks.
After restructuring around regional calendars with separate 90-day countdowns for each region, Onam sales increased 22%, post-Onam returns dropped 35%, and distributor NPS improved by 40 points. The brand now runs three parallel festive planning cycles and considers it one of their most impactful operational improvements. Regional analytics from sales analytics and route optimization tools made the multi-cycle approach manageable without overwhelming the planning team.
Technology That Makes Festive Execution Possible
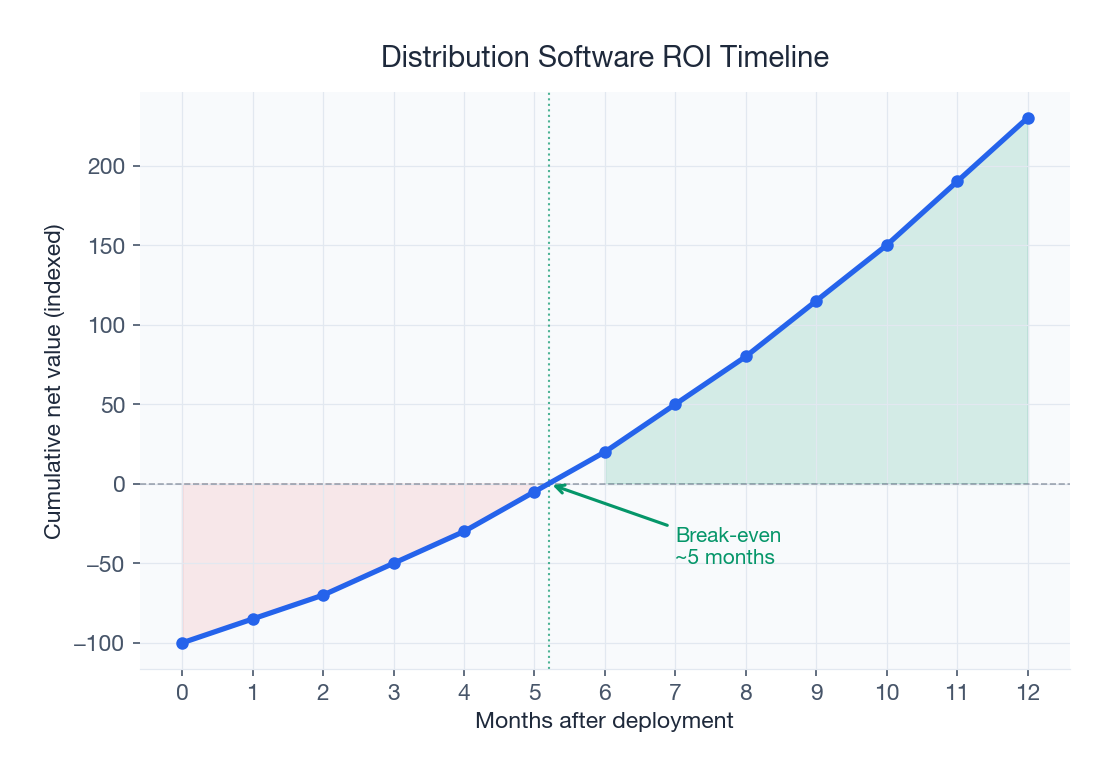
Without the right technology, the daily monitoring, real-time scheme tracking, stock redistribution, and beat compliance enforcement described here cannot happen at scale. A brand managing 200 distributors and 50,000 retailers needs four capabilities: order management that handles 2-3x volume surges, scheme automation with real-time eligibility and budget tracking, distribution tracking with daily visibility into every distributor's stock, and route optimization for dynamically adjusted festive beat plans.
SpireStock integrates all four capabilities in a single platform designed specifically for Indian FMCG and dairy distribution. Our clients use the platform year-round but see the greatest impact during the festive season, when the difference between having real-time visibility and flying blind translates directly into crores of rupees gained or lost.
The festive season will arrive in September whether you are ready or not. The 90-day countdown starts in July. Talk to our team to build your festive distribution plan, or explore our plans to see how SpireStock can help you win the most critical quarter of the year.
Sources & References
Frequently Asked Questions
FMCG companies should start festive season distribution planning 90 days in advance, beginning in July. The July phase covers demand forecasting, budget allocation, scheme design, and temporary warehouse identification. August focuses on stock pre-loading, staff hiring, and fleet expansion. September shifts to execution mode with scheme activation and beat intensification. Starting in September, as many companies do, is too late to secure temporary warehousing, properly pre-load stock, and design effective schemes.
Festive season demand increase varies by category. Sweets and namkeen see 3-5x uplift during Diwali. Dry fruits and chocolates see 4-6x uplift during the gifting window. Dairy products like ghee and paneer see 25-40% uplift from Navratri through Diwali. Home cleaning products see 2-3x uplift before Diwali. Premium and gifting SKUs can see 5-8x uplift during the Dhanteras-to-Bhai Dooj window. Overall, the September-December quarter accounts for 30-40% of annual FMCG revenue.
Accurate festive demand forecasting requires at least three years of historical secondary sales data at the SKU-territory level. Calculate festive uplift factors for each SKU-territory combination. Adjust for new products, lost distributors, or pricing revisions. For greater accuracy, use ML-based models that factor in day-of-week effects, weather patterns, festival date shifts, and competitive activity. A hybrid approach combining historical trends with ML adjustments works best for most Indian FMCG companies.
The best festive scheme strategy uses discrete scheme windows for each festival cluster rather than a continuous three-month offer. Activate trade schemes 7-10 days before each festival and consumer schemes 3-5 days before. Allocate budget proportionally: typically 55% for Diwali, 15% for Navratri-Dussehra, and the rest across smaller festivals. Track scheme utilization daily and use automated scheme engines to prevent leakage, which can account for 15-20% of scheme spending.
Preventing Diwali stockouts requires four steps. First, build an accurate demand forecast using three years of historical data with SKU-territory uplift factors. Second, use phased stock deployment: push 60% in August and hold 40% for rapid replenishment. Third, monitor stock days-of-cover daily at every distributor during October-November with automated alerts. Fourth, build redistribution protocols that allow rapid stock transfer from overstocked to understocked distributors within 18-24 hours.
Post-festive unsold stock management requires swift action in December. Define clear return windows for retailers and distributors. Process returns through your order management system for accurate tracking and prompt credit notes. For unreturnable stock, execute a liquidation strategy including deeper discounts, bundled offers, or institutional sales. Complete all scheme settlements by mid-December. For dairy and perishable products, daily stock aging monitoring in the first two weeks of December is essential.
Effective festive distribution requires four technology capabilities: order management that handles 2-3x volume increases, scheme automation with real-time eligibility checking and budget tracking, distribution tracking with daily visibility into stock levels at every distributor, and route optimization for dynamically adjusting delivery routes. A modern distribution management system integrating all four is essential for brands managing more than 50 distributors.
Regional festivals create distinct demand patterns requiring separate plans. Ganesh Chaturthi drives demand primarily in Maharashtra and Karnataka. Navratri impacts Gujarat and North India most heavily. Durga Puja creates a parallel wave in East India. Onam in Kerala and Pongal in Tamil Nadu follow entirely different calendars. Effective planning requires regional festival calendars with separate demand forecasts, scheme windows, and stock allocations for each region.
Related SpireStock Features
End-to-end order lifecycle from placement to delivery with multi-level approval workflows.
Flexible incentive schemes, flat, bulk-pack, and quantitative, applied automatically.
Powerful dashboards with sales trends, MIS reports, and distribution analytics.
Zone, town, and route-based delivery management with optimization.
Real-time GPS tracking of vehicles and drivers with route optimization for faster deliveries.
Related Industries
Streamline FMCG distribution with order management, beat planning, retailer tracking, and GST billing. Built for Indian FMCG supply chains.
End-to-end dairy distribution software for milk, curd, paneer, and ghee brands. Manage orders, crates, cold chain, and GST billing in one platform.
Related Solutions
Manage your entire distributor network digitally. Onboarding, credit limits, outstanding tracking, and performance analytics. Start free trial.
Automate trade schemes, incentives, and promotional offers. Flat, bulk-pack, quantitative, and FOC schemes with ROI tracking. Try SpireStock.
Related Entities
Ready to Streamline Your Distribution?
Start your free 30-day trial and see how SpireStock can transform your dairy, FMCG or consumer-goods distribution operation, from order capture to crate recovery.
SpireStock Team
Product & Industry Insights
SpireStock Team leads product at SpireStock, where the team ships distribution management software for India's dairy, FMCG and consumer-goods brands.


