Why Route Optimization Is Critical for Milk Delivery
Milk delivery operates under constraints that make route optimization both critical and uniquely challenging. Products are perishable with a shelf life measured in hours, delivery windows are tight (typically 4-6 hours for morning delivery), vehicles are capacity-constrained, and routes must be recalculated frequently based on changing daily order volumes. Yet the vast majority of Indian dairy distributors, even those handling 5,000+ litres daily, still plan routes manually, drawing on experience and habit rather than data and algorithms.
The result? Routes that waste 25-35% of delivery capacity on unnecessary kilometres, time stuck in traffic, and suboptimal stop sequences. For a dairy operation running 10 vehicles across a city like Bangalore or Pune, this translates to Rs 1-2 lakh monthly in avoidable fuel, labour, and vehicle wear costs. Over a year, that is Rs 12-24 lakh, enough to fund an entire technology upgrade.
This guide walks you through implementing route optimization for milk delivery, from mapping your current routes to deploying algorithm-driven dynamic routing. If you want to see the impact on your specific operation, request a route efficiency audit from our team.
Understanding Route Optimization for Dairy
Route optimization for milk delivery is not just about finding the shortest path between two points. It is a multi-constraint optimization problem, finding the optimal sequence of deliveries that minimizes total cost while satisfying every operational constraint simultaneously:
- Time windows, Each retailer has preferred delivery hours. Tea stalls need milk by 5 AM, supermarkets by 9 AM, restaurants by 10 AM
- Vehicle capacity, Weight and volume limits for each vehicle type (three-wheelers: 300-500 litres; mini-trucks: 1,000-2,000 litres; full trucks: 5,000+ litres)
- Product requirements, Cold chain products need temperature-controlled vehicles. Mixing ambient and chilled products requires careful compartmentalization
- Traffic patterns, Real-time and historical traffic data affects actual transit times. A route that takes 30 minutes at 4 AM can take 90 minutes at 8 AM
- Driver availability, Working hours, break requirements, familiarity with areas, and skill levels (some drivers handle refrigerated trucks, others do not)
- Priority deliveries, Hospital canteens, school milk programs, and key institutional accounts may require guaranteed early delivery
- Return logistics, Empty crate and returnable asset collection must be factored into route planning
The mathematical complexity is staggering. A route with just 25 stops has over 15 trillion possible sequences. No human can evaluate even a fraction of these possibilities. This is why algorithm-based optimization consistently outperforms manual planning.
The Cost of Inefficient Routing
| Fleet Size | Extra Km/Day (Inefficient) | Monthly Fuel Waste | Monthly Labour Waste | Total Monthly Loss |
|---|---|---|---|---|
| 5 vehicles | 50-80 km | Rs 15,000-25,000 | Rs 10,000-15,000 | Rs 25,000-40,000 |
| 10 vehicles | 100-160 km | Rs 30,000-50,000 | Rs 20,000-30,000 | Rs 50,000-80,000 |
| 25 vehicles | 250-400 km | Rs 75,000-1,25,000 | Rs 50,000-75,000 | Rs 1,25,000-2,00,000 |
| 50 vehicles | 500-800 km | Rs 1,50,000-2,50,000 | Rs 1,00,000-1,50,000 | Rs 2,50,000-4,00,000 |
Step 1: Map Your Current Routes and Establish Baselines
Before optimizing, you need to document your existing routes thoroughly. This baseline serves two purposes: it identifies the biggest improvement opportunities, and it gives you a benchmark to measure optimization impact against.
- Map every delivery point with GPS coordinates, Use Google Maps or your distribution tracking system to pin every retailer, institution, and delivery location. Include secondary contact numbers and landmark descriptions for locations that GPS does not pinpoint accurately.
- Record actual delivery times and durations, For 2 weeks, have drivers log arrival time, departure time, and waiting time at each stop. This reveals which stops are time-sinks and which are quick handoffs.
- Note traffic bottlenecks and timing patterns, Identify stretches where morning traffic consistently slows delivery. In cities like Mumbai, a 2 km stretch near a market can add 20 minutes during peak hours.
- Calculate current cost per delivery and per route, Include fuel, driver wages (including overtime), vehicle depreciation, and crate handling time. This gives you the unit economics to improve.
- Identify delivery failures, Track shops that were skipped due to time pressure, late deliveries that resulted in complaints, and returns caused by delayed cold chain delivery.
Most dairy companies discover that their current routes have 25-40% inefficiency when they first measure properly. That gap is your optimization opportunity.
Step 2: Cluster Delivery Points Geographically
Group nearby delivery points into geographic clusters. Each cluster becomes a candidate route or route segment. Effective clustering:
- Reduces dead kilometres between stops, the distance travelled without making a delivery
- Enables realistic time estimates per route, a cluster of 30 nearby stops is more predictable than 30 scattered stops
- Allows vehicle assignment based on cluster volume, high-volume clusters get larger vehicles, low-volume clusters get three-wheelers
- Simplifies driver training, drivers who know their cluster area intimately can navigate faster and handle exceptions better
Clustering Methods
Manual clustering works for small networks (under 100 delivery points). For larger networks, use algorithmic clustering:
- Geographic proximity, Group by 1-2 km radius zones. Simple and intuitive but ignores road networks and barriers
- Drive-time clustering, Group by actual driving time rather than straight-line distance. More accurate for cities with rivers, highways, and one-way systems
- Volume-balanced clustering, Ensure each cluster has roughly equal delivery volume, so vehicles are loaded efficiently
SpireStock's route engine performs automatic drive-time clustering that accounts for road networks, traffic patterns, and vehicle capacity constraints simultaneously.
Step 3: Sequence Stops Optimally Within Each Cluster
Within each cluster, the delivery sequence matters enormously. Delivering to 30 stops in the wrong order can add 30-60 minutes to a route. The optimal sequence considers:
- One-way traffic patterns, especially critical in dense urban areas where U-turns are prohibited
- Retailer delivery window preferences, tea stalls first (4-5 AM), then kirana stores (6-8 AM), then modern trade (9-10 AM)
- Unloading time at each stop, a supermarket taking 50 crates needs 15 minutes; a small shop taking 2 crates needs 2 minutes
- Left-turn avoidance, eliminating left turns at uncontrolled intersections reduces waiting time and accident risk
- Cold chain priority, deliver ice cream and fresh paneer stops first when vehicle temperature is lowest
- Crate exchange logistics, stops where you expect large crate returns should not be at the beginning when the vehicle is fully loaded
SpireStock's route optimization engine calculates optimal sequences automatically, considering all these factors simultaneously, something impossible to do manually for routes with 30+ stops. The algorithm evaluates thousands of possible sequences per second and converges on the optimal solution within moments.
Step 4: Implement Dynamic Routing
Static routes, the same sequence of stops every day, become suboptimal quickly as orders change. Dynamic routing recalculates routes based on each day's actual conditions:
- Daily order volume changes, Monday volumes may differ from Friday volumes by 20-30%. Routes should reflect this, not run the same sequence regardless
- New delivery points, When a new retailer is onboarded, the system automatically assigns them to the optimal route rather than tacking them onto the nearest existing route
- Real-time traffic conditions, Integration with Google Maps traffic data allows re-routing around unexpected congestion
- Vehicle availability, When a vehicle is in maintenance, orders are redistributed across remaining vehicles with optimized routing
- Priority order insertions, Emergency orders or VIP customer requests can be inserted into active routes with minimal disruption
- Seasonal variations, Festival seasons, monsoon disruptions, and summer demand spikes all require route adjustments
Companies like Country Delight and Mother Dairy use dynamic routing to handle thousands of daily deliveries across multiple cities. The same technology is accessible to regional dairies through platforms like SpireStock.
Step 5: Monitor, Measure, and Refine Continuously
Use GPS tracking and delivery analytics to continuously monitor route performance:
- Planned vs actual route comparison, Where do drivers deviate? Consistent deviations may indicate that the planned route needs adjustment, or that drivers need retraining
- Delivery timeliness tracking, Which stops are consistently late? These may need to be moved earlier in the sequence or assigned to a different route
- Fuel consumption per route, Unexplained fuel spikes indicate either route deviation, vehicle issues, or unauthorized stops
- Driver efficiency analysis, Compare drivers on the same routes. If Driver A consistently finishes 30 minutes faster than Driver B, understand why and replicate best practices
- Stop-level dwell time, Identify stops where drivers spend excessive time. This could indicate parking issues, complex unloading, or personal stops
Use these insights to refine routes weekly. Route optimization is not a one-time exercise, it is a continuous improvement process. The best dairy operations review and adjust routes every 1-2 weeks based on analytics data.
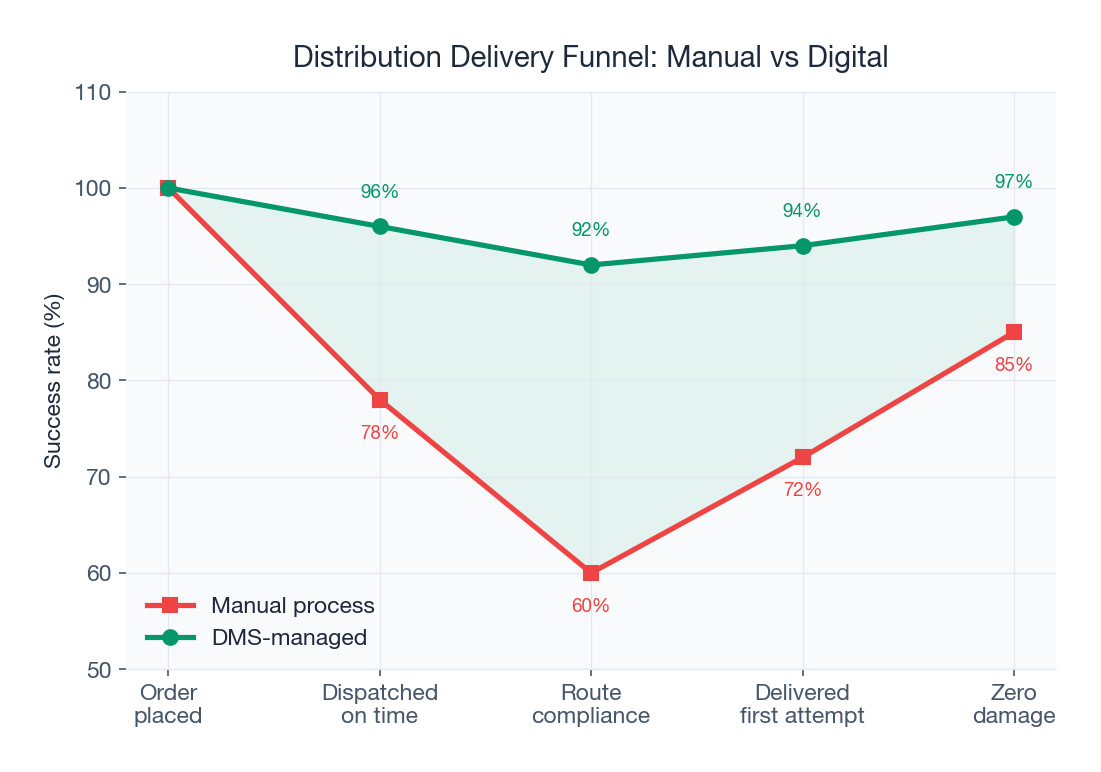
Technology vs Manual Route Planning: A Detailed Comparison
| Factor | Manual Planning | Software-Based Optimization |
|---|---|---|
| Planning time | 2-4 hours daily | 5-10 minutes daily |
| Variables considered | 5-8 (time windows, distance) | 50+ (traffic, capacity, priorities, etc.) |
| Adaptability | Slow, next-day changes only | Real-time rerouting possible |
| Scalability | Breaks above 5 vehicles | Handles 5 to 500 vehicles |
| Route efficiency | 60-75% of optimal | 90-98% of optimal |
| Cost per delivery | Higher by 20-35% | Baseline |
| Driver dependency | High, knowledge in driver heads | Low, routes are in the system |
| Setup cost | Nil | Rs 15,000-50,000 (one-time) |
| Monthly cost | Rs 20,000-40,000 (planner salary) | Rs 5,000-15,000 (software subscription) |
Manual route planning by experienced route managers can be adequate for very small operations (under 5 vehicles, under 100 delivery points). Beyond that threshold, the complexity exceeds human capability. Software-based route optimization considers hundreds of variables simultaneously and produces solutions that are consistently 20-30% more efficient than manual planning. For fleet management at scale, it is no longer optional, it is a requirement.
Implementation Roadmap: From Manual to Optimized
- Week 1-2: Baseline mapping, Map all delivery points, record current routes and timings, calculate current costs. Estimated effort: 2-3 person-days. Cost: Internal effort only.
- Week 2-3: Software setup, Deploy route optimization software. Configure vehicles, delivery points, time windows, and capacity constraints. Estimated cost: Rs 15,000-50,000 one-time setup + monthly subscription.
- Week 3-4: Parallel testing, Run optimized routes alongside existing routes for comparison. Measure the gap in kilometres, time, and cost per delivery.
- Week 4-5: Full rollout, Switch all routes to optimized planning. Train drivers on new route procedures and mobile app-based navigation.
- Week 6+: Continuous optimization, Weekly route reviews, monthly performance analysis, ongoing refinement based on data.
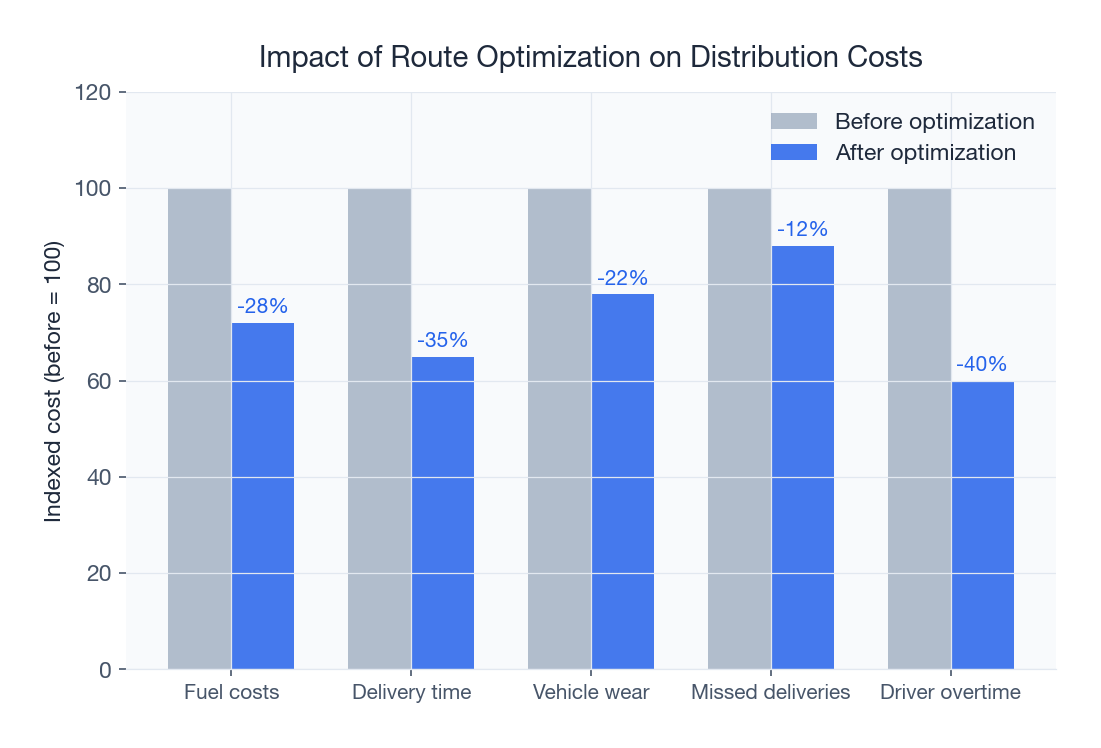
Expected Results and ROI
- 20-30% reduction in delivery costs through shorter, more efficient routes, typically Rs 50,000-2,00,000 monthly savings depending on fleet size
- 15-25% improvement in delivery timeliness through better scheduling and realistic time estimates
- 10-15% increase in delivery capacity, same vehicles serve more stops, delaying the need for fleet expansion
- Reduced driver overtime, efficient routes finish within normal working hours, saving Rs 3,000-5,000 per driver per month
- Lower vehicle wear and maintenance, fewer kilometres mean lower tyre, brake, and engine maintenance costs
- Improved cold chain compliance, shorter routes mean less time at risk temperature, especially critical for dairy cold chain management
- Better customer satisfaction, consistent, on-time delivery builds retailer loyalty and reduces churn
For most dairy operations, route optimization software pays for itself within 30-60 days. Talk to our team about a free route efficiency assessment for your operation, and check our plans to find the right fit for your fleet size.
Sources & References
Frequently Asked Questions
Route optimization typically reduces delivery costs by 20-30%. For a dairy operation running 10 vehicles, this translates to Rs 1-2 lakh monthly in fuel, driver time, and vehicle wear savings.
For operations with more than 5 vehicles, software is significantly better. Route optimization algorithms consider hundreds of variables simultaneously and produce solutions 20-30% more efficient than manual planning. For small operations (1-3 vehicles), manual planning may suffice.
Route optimization for milk delivery considers delivery time windows, vehicle capacity, product temperature requirements, traffic patterns, and driver availability to calculate the most efficient delivery sequence for each vehicle each day.
Yes. Dynamic route optimization recalculates routes daily based on actual orders, vehicle availability, and conditions. SpireStock's route engine automatically generates optimized routes each day based on that day's specific orders and constraints.
With SpireStock, route optimization can be set up in 1-2 weeks. The main setup involves mapping delivery points with GPS coordinates, configuring vehicle information, and setting delivery time windows. The algorithm handles the rest.
Related SpireStock Features
Related Solutions
GPS fleet tracking, driver management, and route optimization for dairy and FMCG delivery vehicles. Reduce fuel costs by 25%. Try SpireStock.
Manage your entire distributor network digitally. Onboarding, credit limits, outstanding tracking, and performance analytics. Start free trial.
Related Entities
Ready to Streamline Your Distribution?
Start your free 30-day trial and see how SpireStock can transform your dairy, FMCG or consumer-goods distribution operation, from order capture to crate recovery.
SpireStock Team
Distribution Technology Experts
SpireStock Team writes for SpireStock on distribution management, supply-chain optimisation and field operations for Indian dairy and FMCG brands.


